The equipment rental business hit a sweet spot in 2011 that continued well into 2012. In our opinion, the market will benefit from a number of tailwinds allowing it to continue growing at double-digit rates into 2014 and perhaps beyond. Overall, we are forecasting that 2013 U.S. rental of construction equipment will increase 16% to more than $32 billion.
The economic uncertainty that has prevailed for several years has actually been a big benefit for the rental industry. Equipment users facing an uncertain future have turned to renting as a way to conserve cash. Renting is also an alternative for users who may be unable to obtain equipment purchase financing. The case for rentals is still strongest for equipment users that are utilizing their machines 50% of the time or less. Anyone who has a need for a production machine that is a primary tool in their fleet would be better off purchasing it. Another factor benefiting rentals is EPA emission regulations that began in January 1, 2012. The regulations require many new machines built after January 1, 2012, to be equipped with Tier IV interim engines. Machines equipped with Tier IV interim engines cost more than machines with Tier III engines. Furthermore the operating performance is not known. Preliminary indications are that the new engines are more expensive to operate as well. The higher operating cost indications are based on the experience of on-highway truck users who have been operating Tier IV engines since 2012. The higher machine purchase price and uncertain operating performance also have caused uncertainty over the future residual values of new machines which is another factor that has driven users to favor rentals.
Recent data indicate that 52% of all new machines sold are going into the rental fleets of national rental companies, authorized dealer rental fleets and rental fleets owned by independents.
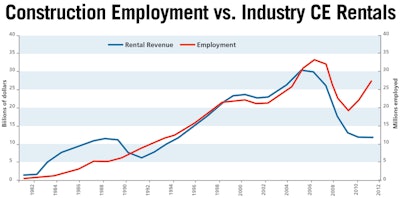
Traditionally the rental industry has followed construction employment. However, after reviewing recent data it appears the close correlation between employment and rental revenues did not exist in 2012 so far. We attribute the lack of correlation to economic uncertainty which is hard to measure and put on a graph.
Construction Employment vs. Industry CE Rentals
GRAPH 1
Rental Revenues historically
tied to construction employment
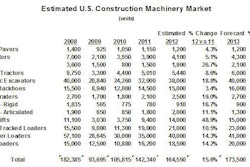
Our forecast for the economy as a whole is for slow growth. The 2013 market will benefit from an improving housing market, continued high levels of demand from the energy sector and improving non-residential construction investment by manufacturers. Overall we expect 2013 growth of equipment sales to be approximately 5.4% compared with 2012. We expect the sales slowdown that began in the second half of 2012 to extend into the first half of 2013 and most of the 2013 growth to occur in the second half. Assumptions for the construction sector are:
GRAPH 2
Value of Construction put in place
(Millions of dollars)
|
Type of construction |
2012 vs. 2011 Percent change |
2013 vs. 2012 Percent change |
|
Total construction |
8.0% |
10.% |
|
Residential |
20.0% |
30.0% |
|
Nonresidential |
3.0% |
6.0% |
|
Lodging |
25.0% |
15.0% |
|
Office |
2.4% |
2.0% |
|
Transportation |
11.0% |
15.0% |
|
Power |
19.2% |
12.0% |
|
Manufacturing |
1.0% |
4.0% |
The national rental companies had a great year in 2012. Revenues grew in a range from 8% to 38% with an average of approximately 12%.
GRAPH 3
Rental revenues
Third quarter vs. same period one year ago
*Sunbelt first quarter ended July 31
|
Company |
2012 vs. 2011 |
2011 vs. 2010 |
2010 vs. 2009 |
2009 vs. 2008 |
|
Essex Crane |
38.0% |
65.5% |
-39.2% |
-38.7% |
|
RSC Equipment Rental |
Merged with UR |
24.0% |
-9.8% |
-30.6% |
|
Sunbelt* |
19.6% |
21.0% |
25.5% |
-25.5% |
|
United Rentals |
8.7% |
19.0% |
5.1% |
-27.0% |
|
H&E Equipment Services |
27.2% |
26.8% |
|
|
|
HERC |
12.2% |
14.1% |
|
|
Rental revenue growth has been driven by supply and demand. Fleet utilization rates (based on time) were the highest they have been since 2008 which has allowed companies to aggressively increase their rates.
GRAPH 4
Third-quarter year-to-date
fleet time utilization
|
Company |
2012 |
2011 |
2010 |
2009 |
|
RSC Equipment Rental |
Merged with UR |
*73.0% |
|
|
|
United Rentals - Total |
69.8% |
74.0% |
71.0% |
67.0% |
|
Booms & Lifts |
74.8% |
|
|
|
|
Earthmoving |
63.2% |
|
|
|
|
Essex Rental Corp. |
|
39.0% |
35.1% |
46.6% |
|
Crawler cranes |
43.4% |
|
|
|
|
Rough terrain |
69.3% |
|
|
|
|
Tower cranes |
54.7% |
|
|
|
|
Boom trucks |
61.9% |
|
|
|
|
Sunbelt Rentals |
70.0% |
72.0% |
|
|
|
H&E Equipment Services |
72.9% |
68.9% |
67.1% |
|
|
HERC |
Not |
64.5% |
|
|
GRAPH 5
Rental Rates
Nine months ended Sept 30*
*Sunbelt first quarter ended July 31
|
Company |
2012 |
2011 vs. 2010 Percent change |
2010 vs. 2009 Percent change |
2009 vs. 2008 Percent change |
|
Essex Rental Corp. |
10.7% |
|
|
|
|
RSC Equipment Rental |
Merged with UR |
4.6% |
-4.4% |
-9.4% |
|
Sunbelt Rentals* |
4.0% |
10.0% |
-5.0% |
|
|
United Rentals |
7.5% |
7.5% |
-2.1% |
-12.5% |
|
H&E Equipment Services |
10.5% |
8.9% |
-9.6% |
-15.1% |
|
HERC |
3.5% |
13.3% |
-5.4% |
-8.6% |
Rental companies have been hard pressed to keep up with the growth of the market. As a result we saw massive capital expenditures in both of the past two years. Most of the companies have said they will continue adding to their fleets in 2013, however, the mix will be different. In 2011 and 2012 rental companies anticipated that demand for earthmoving equipment would come back before demand for aerials and lifting equipment. In both years rental companies changed the mix of their fleets toward earthmoving and away from from platforms and lifting equipment. Billions were spent which greatly benefited the equipment manufacturers.
GRAPH 6
Capital expenditures
(Millions of dollars)
Purchases of Rental Equipment
Nine months ended Sept. 30
|
Company |
2012 |
2011 |
2010 |
2009 |
2008 |
|
RSC Equipment Rental |
Merged |
$176.0 |
$33.5 |
-$101.3 |
$152.3 |
|
United Rentals |
$1,321.0 |
$1,390.0 |
$346.0 |
$29.0 |
$434.0 |
|
H&E Equipment Services |
$175.0 |
$90.6 |
|
|
|
|
HERC |
$606.0 |
$412.5 |
|
|
|
Higher capital expenditures drove down the average fleet age of many of the national rental companies which has the added benefit of lowering their maintenance expenses.
GRAPH 7
Average fleet age
Year ending September (Months)
*Sunbelt first quarter ended July 31
|
Company |
2012 |
2011 |
2010 |
2009 |
2008 |
|
Herc |
Not published |
78.0 |
43.0 |
42.5 |
34.0 |
|
RSC Equipment Rental |
Merged |
41.0 |
43.0 |
38.0 |
34.0 |
|
Sunbelt Rentals* |
33.0 |
40.0 |
46.0 |
38.0 |
34.0 |
|
United Rentals |
46.4 |
46.6 |
47.7 |
42.4 |
38.0 |
|
Essex Rental Corp. |
|
|
14 .0 |
14.0 |
14.0 |
|
H&E Equipment Services |
38.6 |
43.2 |
|
|
|
Rental company profits have benefited from the perfect storm of rising demand for rental and increased rental rates and higher fleet utilization. These factors have allowed them to make huge investments in new fleet which lowered their operating cost and increased their margins.
GRAPH 8
ebitda margin
Nine months ended Sept 30
*Sunbelt first quarter ended July 31
|
Company |
2012 |
2011 |
2010 |
2009 |
2008 |
|
RSC Equipment Rental |
Merged |
40.1% |
32.5% |
32.5% |
44.5% |
|
Sunbelt Rentals* |
42.5% |
37.3% |
32.5% |
34.5% |
36.8% |
|
United Rentals |
46.8% |
38.8% |
26.6% |
26.6% |
32.1% |
|
H&E Equipment Services |
27.3% |
21.9% |
18.8% |
18.8% |
23.3% |
|
HERC |
41.0% |
42.1% |
41.7% |
41.7% |
45.0% |
We believe the U.S. equipment rental market for construction equipment reached approximately $28 billion in 2012. Based on the trends of the underlying markets, We believe the total market will grow to more than $32 billion in 2013. That forecast is based on our estimate that there will be approximately 14,000 rental locations in 2013 and the average revenues per location will be slightly more than $2.3 million. We realize, of course, that United Rentals will probably close nearly 200 locations this year as it rationalizes locations obtained in its merger with RSC. In addition, it is likely that Ahern, which is fighting for survival, may be forced to close some branch operations. But we believe there has been significant growth of locations among independent rental companies that will cause the absolute number of branches to increase a little over 100 locations. While the absolute quantity of locationsremains relatively constant, the revenues generated per location continue to increase.
Overall, we are forecasting that 2013 U.S. rental of construction equipment will increase 16% to more than $32 billion.
GRAPH 9
Growth of the construction
equipment Rental market
|
Year |
Estimated number locations |
Estimated rent revenue per location (thousands) |
Estimated CE Rentals industry rent revenue (hundred thousands) |
Percent change from previous year |
|
2013 |
14,100 |
$2,313 |
$32,615 |
16% |
|
2012 |
13,975 |
$2,019 |
$28,224 |
12% |
|
2011 |
13,830 |
$1,822 |
$25,200 |
17% |
|
2010 |
14,208 |
$1,518 |
$21,571 |
-15% |
|
2009 |
14,648 |
$1,733 |
$25,377 |
-30% |
|
2008 |
15,750 |
$2,302 |
$36,253 |
-4% |
|
2007 |
15,865 |
$2,372 |
$37,636 |
8% |
|
2006 |
15,708 |
$2,218 |
$34,848 |
20% |
|
2005 |
15,400 |
$1,886 |
$29,040 |
9% |
|
2004 |
14,000 |
$1,895 |
$26,530 |
11% |
|
2003 |
14,005 |
$1,723 |
$23,927 |
1% |
|
2002 |
13,250 |
$1,790 |
$23,717 |
-4% |
|
2001 |
13,500 |
$1,837 |
$24,800 |
0% |
|
2000 |
13,932 |
$1,780 |
$24,784 |
3% |