- New orders, production and employment growing
- Supplier deliveries slowing at faster rate
- Backlog growing
- Manufacturing inventories growing
- Customers' inventories too low
- Prices increasing
- Exports growing and imports contracting
- Average lead times in October for production materials and Maintenance, Repair and Operating (MRO) supplies were the longest since ISM began collecting this data in 1987
Manufacturing economic indicators faltered slightly in October, according to a survey of those in the industry. The slight dip was attributed to ongoing supply chain issues. According to one economic expert, “all segments of the manufacturing economy are impacted by record-long raw materials lead times, continued shortages of critical materials, rising commodities prices and difficulties in transporting products.”
Overall, economic activity in the manufacturing sector grew in October, with the economy achieving a 17th consecutive month of growth, say the nation's supply executives in the latest Manufacturing ISM Report on Business.
The report was issued Nov. 1 by Timothy R. Fiore, chair of the Institute for Supply Management (ISM) Manufacturing Business Survey Committee. The Manufacturing PMI, or the Purchasing Managers’ Index, is a set of economic indicators based off surveys of private-sector companies.
"The October Manufacturing PMI registered 60.8%, a decrease of 0.3 percentage point from the September reading of 61.1%,” Fiore says. “This figure indicates expansion in the overall economy for the 17th month in a row after a contraction in April 2020.”
The New Orders Index registered 59.8%, down 6.9 percentage points compared to the September reading of 66.7%. The Production Index registered 59.3%, a decrease of 0.1 percentage point compared to the September reading of 59.4%. The Prices Index registered 85.7%, up 4.5 percentage points compared to the September figure of 81.2%.
“Customer demand remains high,” one survey respondent in the machinery sector says. “COVID-19 related supply chain issues still hamper our ability to meet demand. Labor is still difficult for our suppliers to obtain, and labor costs are rising.”
The Backlog of Orders Index registered 63.6%, 1.2 percentage points lower than the September reading of 64.8%. The Employment Index registered 52%, 1.8 percentage points higher compared to the September reading of 50.2%.
The Supplier Deliveries Index registered 75.6%, up 2.2 percentage points from the September figure of 73.4%. The Inventories Index registered 57%, 1.4 percentage points higher than the September reading of 55.6%. The New Export Orders Index registered 54.6%, an increase of 1.2 percentage points compared to the September reading of 53.4%. The Imports Index registered 49.1%, a 5.8-percentage point decrease from the September reading of 54.9%.
“Business Survey Committee panelists reported that their companies and suppliers continue to deal with an unprecedented number of hurdles to meet increasing demand,” he says. “All segments of the manufacturing economy are impacted by record-long raw materials lead times, continued shortages of critical materials, rising commodities prices and difficulties in transporting products. Global pandemic-related issues — worker absenteeism, short-term shutdowns due to parts shortages, difficulties in filling open positions and overseas supply chain problems — continue to limit manufacturing growth potential.”
Despite these challenges, survey respondents remain optimistic.
“Panelists are fully focused on supply chain issues in order to respond to the ongoing high levels of demand,” Fiore says. “Demand expanded, with the New Orders Index growing, supported by continued expansion of the New Export Orders Index, Customers' Inventories Index remaining at very low levels, and Backlog of Orders Index staying at a very high level.”
Consumption, measured by the Production and Employment indexes, grew during the period, with a combined 1.7-percentage point increase to the Manufacturing PMI calculation. Although the Employment Index expanded for a second month, hiring difficulties at panelists' companies show no significant signs of abating. Inputs — expressed as supplier deliveries, inventories, and imports — continued to help constrain production expansion, especially with a contraction in imports, compared to September.
The Supplier Deliveries Index slowed, while the Inventories Index continued to expand faster due to work-in-process inventory held longer due to key part shortages and more finished goods inventory held due to downstream customer issues. The Prices Index expanded for the 17th consecutive month, at a faster rate in October, indicating continued supplier pricing power and scarcity of supply chain goods.
All of the six biggest manufacturing industries — food, beverage and tobacco products; computer and electronic products; chemical products; fabricated metal products; petroleum and coal products; and transportation equipment, in that order — registered moderate to strong growth in October.
"Manufacturing performed well for the 17th straight month, with demand and consumption registering month-over-month growth, in spite of continuing unprecedented obstacles, including the Imports Index moving into contraction territory and ever-increasing demand,” Fiore says. “Meeting demand remains a challenge, due to hiring difficulties and a clear cycle of labor turnover: As workers opt for more attractive job opportunities, panelists' companies and their suppliers struggle to maintain employment levels. Disruptions from COVID-19, primarily in southeast Asia, continue to have an impact on many industry sectors. Congestion at ports in China and the U.S. continues to be a headwind, as transportation networks remain stressed. Demand remains at strong levels, despite increasing prices.”
The 16 manufacturing industries reporting growth in October, in the following order, are: apparel, leather and allied products; furniture and related products; textile mills; electrical equipment, appliances and components; machinery; printing and related support activities; food, beverage and tobacco products; computer and electronic products; chemical products; fabricated metal products; miscellaneous manufacturing; petroleum and coal products; plastics and rubber products; paper products; primary metals; and transportation equipment. The two industries reporting a decrease in October compared to September are wood products; and nonmetallic mineral products.
“Demand for our products remains strong, but we continue to struggle to secure enough raw material to keep our manufacturing lines running,” one survey respondent in miscellaneous manufacturing says.
Commodities
The following commodities are up in price (in parentheses is the number of months prices have been increasing): adhesives (4); aluminum (17); aluminum products (7); caustic soda (5); copper (2); copper-based products; corn; corrugate (13); corrugated packaging (12); crude oil; diesel fuel (10); electrical components (11); electronic components (11); foam (2); freight (12); isocyanate; labor — temporary (6); logistics services (2); maintenance, repair, and operations (MRO) supplies (2); motors; natural gas (4); nylon; ocean freight (11); packaging supplies (11); pallets (4); paper (2); phosphates; plastic containers (2); plastic resins (14); polyester resin; polyethylene (9); polyethylene terephthalate (pet); polypropylene (16); polyvinyl chloride (PVC); printed circuit board assemblies (PCBAS); printed circuit boards (PCBS); resin-based products (9); rubber-based products (3); semiconductors (9); steel (15); steel, bars; steel, carbon (11); steel, cold rolled (3); steel, drums (2); steel, hot rolled (14); steel, stainless (12); steel products (14) and tin products.
Wood is the only commodity down in price.
Commodities in short supply include: adhesives and paints (4); caustic soda; corrugated packaging (4); electrical components (13); electronic components (11); foam; freight (2); labor, temporary (6); ocean freight (7); ocean freight containers; packaging supplies; pallets; phosphates; plastic containers (2); plastic products (9); plastic resins, other (8); polyvinyl chloride (PVC) (2); printed circuit board assemblies (PCBAS) (3); rubber-based products (3); semiconductors (11); silane; silicon; steel (11); steel, hot rolled (12); steel, stainless (8) and steel products (9).
 ISM
ISM
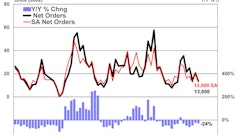
New Orders
ISM's New Orders Index registered 59.8% in October, a decrease of 6.9 percentage points compared to the 66.7% reported in September. This indicates that new orders grew for the 17th consecutive month.
“All of the six largest manufacturing sectors: chemical products; food, beverage and tobacco products; petroleum and coal products; computer and electronic products; fabricated metal products and transportation equipment, in that order, expanded at moderate to strong levels,” Fiore says.
A New Orders Index above 52.8%, over time, is generally consistent with an increase in the Census Bureau's series on manufacturing orders (in constant 2000 dollars).
Fourteen of 18 manufacturing industries reported growth in new orders in October, in the following order: apparel, leather and allied products; furniture and related products; printing and related support activities; textile mills; primary metals; chemical products; food, beverage and tobacco products; machinery; petroleum and coal products; miscellaneous manufacturing; computer and electronic products; electrical equipment, appliances and components; fabricated metal products; and transportation equipment. The two industries reporting a decline in new orders in October are nonmetallic mineral products; and plastics and rubber products.
 ISM
ISM
Production
The Production Index registered 59.3% in October, 0.1 percentage point lower than the September reading of 59.4%, indicating growth for the 17th consecutive month.
“All of the top six industries: petroleum and coal products; fabricated metal products; chemical products; computer and electronic products; transportation equipment; and food, beverage and tobacco products, in that order, expanded at strong to moderate levels,” Fiore says.
“Raw materials continued to be a constraint to production growth, as manufacturing inventories continued to expand. Staffing levels on the factory floor remain an obstacle, with direct-labor turnover and retirements continuing a negative trend,” he says.
An index above 52.1%, over time, is generally consistent with an increase in the Federal Reserve Board's Industrial Production figures.
The 10 industries reporting growth in production during the month of October, listed in order, are: petroleum and coal products; furniture and related products; electrical equipment, appliances and components; machinery; fabricated metal products; chemical products; computer and electronic products; miscellaneous manufacturing; transportation equipment; and food, beverage and tobacco products. The four industries reporting a decrease in October are: printing and related support activities; wood products; primary metals; and plastics and rubber products.
 ISM
ISM
Employment
ISM's Employment Index registered 52% in October, 1.8 percentage points above the September reading of 50.2%.
“The Employment Index reported a second month of expansion,” Fiore says. “Of the six big manufacturing sectors, three (computer and electronic products, fabricated metal products and chemical products) expanded. Survey panelists' companies are still struggling to meet labor-management plans, but for a second month, there were modest signs of progress: An increasing percentage of comments noted improvements regarding employment, compared to less than 5% in September.”
He says an overwhelming majority of panelists indicate their companies are hiring or attempting to hire; 90% of Employment Index comments were about seeking additional staffing. Twenty-eight percent of those respondents expressed difficulty in filling positions, a decrease from September. The increasing frequency of comments on turnover rates and retirements in October continued a trend that began in August, he says.
An Employment Index above 50.6%, over time, is generally consistent with an increase in the Bureau of Labor Statistics (BLS) data on manufacturing employment.
Of 18 manufacturing industries, the 11 industries reporting employment growth in October, in the following order, are: apparel, leather and allied products; textile mills; electrical equipment, appliances and components; furniture and related products; printing and related support activities; plastics and rubber products; machinery; computer and electronic products; fabricated metal products; chemical products; and miscellaneous manufacturing. The six industries reporting a decrease in employment in October, listed in order, are: wood products; nonmetallic mineral products; petroleum and coal products; paper products; food, beverage and tobacco products; and transportation equipment.
 ISM
ISM
Supplier Deliveries
The delivery performance of suppliers to manufacturing organizations was slower in October, as the Supplier Deliveries Index registered 75.6%, 2.2 percentage points higher than the 73.4% reported in September.
All six top manufacturing industries: food, beverage and tobacco products; fabricated metal products; computer and electronic products; transportation equipment; chemical products; and petroleum and coal products, in that order — reported slowing deliveries.
“Deliveries slowed at a faster rate compared to the previous month,” Fiore says. “The index continues to reflect suppliers' difficulties in meeting panelist companies' demand, including ongoing supplier hiring challenges, extended raw materials lead times for all tiers, increasing levels of input material shortages, stubbornly high prices and inconsistent transportation availability. The peak has not been seen yet.”
A reading below 50% indicates faster deliveries, while a reading above 50% indicates slower deliveries.
All 18 industries reported slower supplier deliveries in October, in the following order: apparel, leather and allied products; furniture and related products; paper products; machinery; electrical equipment, appliances and components; nonmetallic mineral products; food, beverage and tobacco products; fabricated metal products; computer and electronic products; miscellaneous manufacturing; plastics and rubber products; printing and related support activities; textile mills; transportation equipment; chemical products; wood products; petroleum and coal products; and primary metals. No industries reported faster supplier deliveries in October.
 ISM
ISM
Inventories
The Inventories Index registered 57% in October, 1.4 percentage points higher than the 55.6% reported for September.
“Manufacturing inventories continued to expand due to panelists' companies stocking more raw materials in hopes of avoiding production shortages, as well as growth in work-in-process and finished-goods inventories,” Fiore says.
An Inventories Index greater than 44.5%, over time, is generally consistent with expansion in the Bureau of Economic Analysis (BEA) figures on overall manufacturing inventories (in chained 2000 dollars).
The 14 industries reporting higher inventories in October, in the following order, are: apparel, leather and allied products; printing and related support activities; textile mills; electrical equipment, appliances and components; furniture and related products; plastics and rubber products; machinery; food, beverage and tobacco products; computer and electronic products; paper products; miscellaneous manufacturing; primary metals; chemical products; and fabricated metal products. The two industries reporting a decrease in inventories in October are wood products; and nonmetallic mineral products.
 ISM
ISM
Customers' Inventories
ISM's Customers' Inventories Index registered 31.7% in October, the same reading from the 31.7% reported for September, indicating that customers' inventory levels were considered too low.
“Customers' inventories are too low for the 61st consecutive month, a positive for future production growth,” Fiore says. “For 15 straight months, the Customers' Inventories Index has been at historically low levels.”
No industries reported higher customers' inventories in October. The 15 industries reporting customers' inventories as too low during October, listed in order, are: nonmetallic mineral products; paper products; primary metals; machinery; wood products; textile mills; plastics and rubber products; fabricated metal products; electrical equipment, appliances and components; miscellaneous manufacturing; food, beverage and tobacco products; chemical products; furniture and related products; computer and electronic products; and transportation equipment.

Prices
The ISM Prices Index registered 85.7%, an increase of 4.5 percentage points compared to the September reading of 81.2%, indicating raw materials prices increased for the 17th consecutive month, at a faster rate in October. This is the 14th month in a row that the index has been above 60% and the 11th straight month it has exceeded 70%.
“Aluminum, basic chemicals, copper, corrugate and packaging materials, electronic components, energy, some plastics and plastic products, freight, and steels continue to remain at elevated prices due to product scarcity,” Fiore says.
A Prices Index above 52.7%, over time, is generally consistent with an increase in the Bureau of Labor Statistics (BLS) Producer Price Index for Intermediate Materials.
In October, all 18 industries reported paying increased prices for raw materials, in the following order: apparel, leather and allied products; nonmetallic mineral products; paper products; printing and related support activities; textile mills; furniture and related products; machinery; petroleum and coal products; chemical products; computer and electronic products; plastics and rubber products; electrical equipment, appliances and components; miscellaneous manufacturing; primary metals; fabricated metal products; transportation equipment; food, beverage and tobacco products; and wood products.
 ISM
ISM
Backlog of Orders
ISM's Backlog of Orders Index registered 63.6% in October, a 1.2-percentage point decrease compared to the 64.8% reported in September, indicating order backlogs expanded for the 16th straight month. This is the ninth consecutive month with a reading above 60%.
“Backlogs expanded at a lower rate in October compared to September, indicating production was able to keep up with continuing strong new order levels. However, backlogs remain at historically high levels. Of the six big industry sectors, five (chemical products; food, beverage and tobacco products; computer and electronic products; fabricated metal products; and transportation equipment) reported that backlogs expanded strongly,” Fiore says.
The 15 industries reporting growth in order backlogs in October, in the following order, are: apparel, leather and allied products; textile mills; paper products; machinery; furniture and related products; wood products; electrical equipment, appliances and components; miscellaneous manufacturing; chemical products; food, beverage and tobacco products; computer and electronic products; fabricated metal products; plastics and rubber products; primary metals; and transportation equipment. The only industry reporting lower backlogs in October is nonmetallic mineral products.
 ISM
ISM
New Export Orders
ISM's New Export Orders Index registered 54.6% in October, up 1.2 percentage points compared to the September reading of 53.4%.
The New Export Orders Index grew for the 16th consecutive month, at a faster rate compared to September. Of the six big industry sectors, five (fabricated metal products; food, beverage and tobacco products; computer and electronic products; chemical products; and transportation equipment) expanded. New export orders were a contributor to the New Orders Index continuing in strong expansion territory, Fiore says.
The 10 industries reporting growth in new export orders in October, in the following order, are: furniture and related products; paper products; primary metals; miscellaneous manufacturing; fabricated metal products; food, beverage and tobacco products; computer and electronic products; machinery; chemical products; and transportation equipment. The only industry reporting a decrease in new export orders in October is plastics and rubber products.
 ISM
ISM
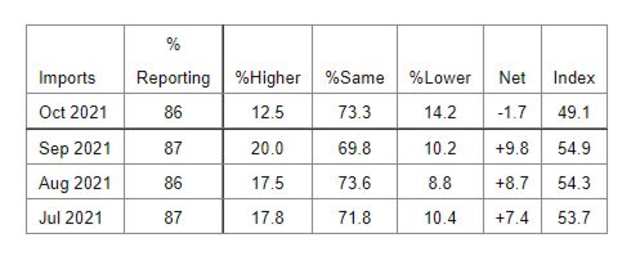
Imports
ISM's Imports Index registered 49.1% in October, a decrease of 5.8 percentage points compared to September's figure of 54.9%.
“Imports contracted in October after 15 consecutive months of expansion, reflecting continuing challenges with throughput at U.S. ports of entry. Overland-transport challenges and container shortages continue to persist across the global supply chain, causing instability with import level projections. Imports will continue to be challenged through the end of 2021 and likely through the first half of 2022,” Fiore says.
The five industries reporting growth in imports in October are: textile mills; chemical products; furniture and related products; food, beverage and tobacco products; and fabricated metal products. The eight industries reporting a decrease in imports in October, in the following order, are: wood products; nonmetallic mineral products; paper products; primary metals; plastics and rubber products; transportation equipment; computer and electronic products; and machinery.
Buying Policy
Average commitment lead time for capital expenditures in October was 156 days, an increase of two days compared to September. Average lead times in October for production materials and Maintenance, Repair and Operating (MRO) supplies were the longest since ISM began collecting this data in 1987, breaking previous records set in September. Average lead time for production materials was 96 days, an increase of four days, and average lead time for MRO supplies was 49 days, up four days compared to the previous month.