July’s level of U.S. construction starts, excluding residential work, was $33.6 billion, a month-to-month change of -5.2% versus June, according to ConstructConnect. The pullback, although not terribly severe, does appear to worsen when the usual June-to-July change of +3.5%, on account of seasonality, is taken into consideration.
Looking ahead, July is the final month in any year when a seasonal lift is expected. From August through February of the following year, the month-to-month tendency is for declines.
Standalone July of this year did, however, have a starts volume that was +3.4% higher than in the same month of last year. More impressively, year-to-date nonresidential starts through the seventh month of 2016 have been +11.6% compared with January-to-July of 2015.
The starts figures throughout this report are not seasonally adjusted (NSA). Nor are they altered for inflation. They are expressed in what are termed ‘current’ as opposed to ‘constant’ dollars.
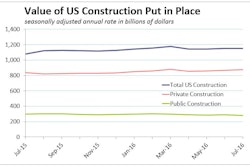
Nonresidential building plus engineering/civil work accounts for a considerably larger share of total construction than residential activity. The former’s combined proportion of total put-in-place construction in the Census Bureau’s June report was 59%; the latter’s was 41%.
According to the latest Employment Situation Report from the Bureau of Labor Statistics (BLS), the total number of jobs in construction in America in July rose by 14,000, bringing the year-to-date total to 55,000. That’s disappointing versus the 136,000 figure through the first seven months of last year. The year-over-year rate of change in construction employment has stayed high, however, at +3.3% which is faster than for all other major industrial subcategories and also almost twice as speedy as for all jobs in the economy as a whole (+1.7%).
The unemployment rate in construction in July tightened to 4.5% from 4.6% in June. A look at historical data reveals that only occasionally, in the past, has construction’s out-of-work yardstick fallen below 5%. A year ago, construction’s jobless rate was 5.5%. Six years ago, when the effects of the Great Recession were being felt most severely in the construction sector, its jobless rate climbed within a hair’s breadth of 25%.
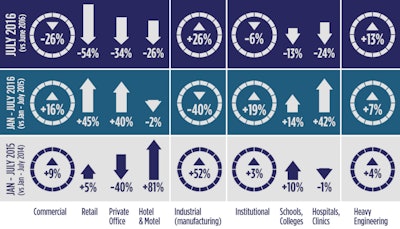
Commercial work, at -26.4%, accounted for much of the -5.2% month-to-month deterioration in total starts in July, although an institutional decline of -6.3% also played a role. Heavy engineering/civil work was +13.1% month-on-month. The smaller volume category of industrial projects was +25.5%. Industrial starts, in any given time frame comparison, can display wild swings depending on the presence or absence of a mega project or two.
The +3.4% performance for starts in July of this year compared with July of last year was led by the institutional category, +17.7%, with a boost also coming from heavy engineering, +10.1%. Commercial and industrial, though, at -15.4% and -65.1% respectively, failed to keep up.
As for year-to-date starts so far in 2016, the three major categories have all improved on their January-through-July 2015 performances. Institutional work (+19.1%) has done best, with commercial (+16.2%) not far behind. Heavy engineering (+6.8%) has also picked up the pace. Only industrial work (-40.4%) has faltered.
The two main subcategories in institutional work are schools/colleges (with a 61% share by year-to-date nominal value) and hospitals/clinics (with a 15% slice). In July, the former was -12.9% month to month (m/m); but +5.6% year over year (y/y); and +13.8% year to date (ytd). The latter was -23.7% m/m; but +35.4% y/y; and a strong +41.5% ytd.
In commercial work, retail/shopping is the largest subcategory (with a 27% share in dollar terms, year to date). July’s results for the store component of starts were -54.2% m/m; but +20% y/y; and a surprisingly good +45.4% ytd. Also important within commercial are private office buildings (-33.9% m/m; but +9.3% y/y; and +40.4% ytd) and government office buildings (-8.2% m/m; and -34.3% y/y; but +21.4% ytd).
Two other commercial subcategories of note are hotels/motels (-26.1% m/m; and -1.8% ytd; but +13.6% y/y) and warehouses (+125.5% m/m; and +3.8% ytd; but -30% y/y).
Engineering work is dominated by roads/highways (with a 42% share) and water/sewage (a one-quarter or 25% slice) projects. Street work in July was down m/m (-5.7%) and y/y (-13.9%), but marginally ahead (+2.4%) ytd. Starts on H2O projects were bubblier according to all three timeframe comparisons: m/m (+18.3%); y/y (+2.1%); and ytd (15.3%).
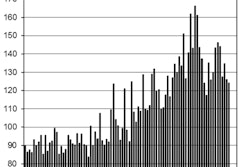
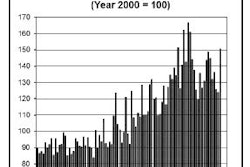
The slopes of the 12-month moving trend graphs have turned mixed. The commercial curve has shifted downward, but two of its main subcategories, retail and private office buildings, have been achieving upward trajectories. Institutional starts have been climbing, backed by rising slopes for schools/colleges and hospitals. In engineering, bridge starts have moved higher, water/sewage starts have flattened out and road/highway starts have tapered off.
No doubt thanks to the tight jobless rate in the sector, the year-over-year earnings of workers in construction, as reported by the BLS for July, suddenly shot up to and past the +3% ceiling. Whereas average hourly and average weekly earnings for all employees on private non-farm payrolls were +2.6% and +2.3% respectively, for construction workers they were +3% and +3.5%.
Excluding supervisory personnel, the discrepancies in wages were even more dramatic. For the economy as a whole, both average hourly and average weekly earnings were +2.6% year over year. In construction, average hourly earnings were +3.5% and average weekly earnings, +4.6%.
The value of construction starts each month is summarized from ConstructConnect’s database of all active construction projects in the U.S. Missing project values are estimated with the help of RSMeans’ building cost models.
ConstructConnect’s nonresidential construction starts series, because it is comprised of total value estimates for individual projects, some of which are ultra-large, has a history of being more volatile than many other leading indicators for the economy.
A “start” is determined by taking the announced bid date and adding a short time lag (30 to 60 days). ConstructConnect continues to follow the project via its network of researchers. If it is abandoned or re-bid, the start date is updated to reflect the new information.
Click here to download the Construction Industry Snapshot Package – July 2016 PDF.
Click here for the Top 10 largest construction project starts in the U.S. – July 2016.
Click here for the Nonresidential Construction Starts Trend Graphs – July 2016.


![[VIDEO] Truck Greenhouse Gas Rules to Boost Fuel Efficiency 24%](https://img.forconstructionpros.com/files/base/acbm/fcp/image/2016/08/default.57c6dba758fbe.png?auto=format%2Ccompress&fit=crop&h=167&q=70&w=250)