October’s level of U.S. construction starts, excluding residential work, was $29.5 billion, a surprisingly nice surge of 15.1% versus the level in the period before, according to ConstructConnect. Usually between September and October there is a -4% drop due to seasonality.
October of this year compared with October of last year was 11%. The volume of year-to-date starts in 2016 versus the same January through October time frame of 2015 has been 8.8%.
The starts figures throughout this report are not seasonally adjusted (NSA). Nor are they altered for inflation. They are expressed in what are termed ‘current’ as opposed to ‘constant’ dollars.
Nonresidential building plus engineering/civil work accounts for a considerably larger share of total construction than residential activity. The former’s combined proportion of total put-in-place construction in the Census Bureau’s September report was 60%; the latter’s was 40%.
ConstructConnect’s construction starts are leading indicators for the Census Bureau’s capital investment or put-in-place series. Also, the reporting period for starts (i.e., October 2016) is one month ahead of the reporting period for the investment series (i.e., September 2016.)
In October, the total number of jobs in the U.S. construction sector rose by a modest 11,000, according to the latest Employment Situation Report from the Bureau of Labor Statistics (BLS). The average monthly climb so far this year has been only 8,000, which compares unfavorably with the 18,000 advance per month during the first 10months of 2015. But the year-over-year jump in employment in construction, at 3%, has been considerably faster than for grand total jobs, 1.7%, and has beaten all other major industrial subcategories. Second place has been a tie between professional and business services and education and health services, both at 2.7%.
The total number of jobs in architectural and engineering services in October was 1.7% year over year (i.e., the same as for grand total jobs). And as a ‘coincident’ indicator, the total number of positions at retail outlets specializing in selling building materials and supplies was 4%.
Construction’s October unemployment rate this year was 5.7%, down from 6.2% 12 months ago.
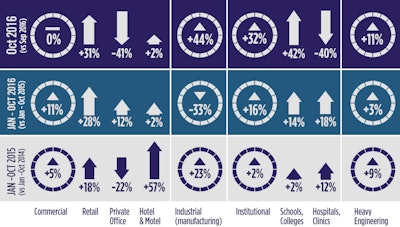
The 15.1% month-to-month increase in total nonresidential starts in October resulted from a big gain in the institutional type-of-structure category (31.5%) and a decent bump in heavy engineering/civil work (11.3%). Industrial contributed a large percentage burst (43.6%), but it’s a smaller volume category and often displays wide swings in any given month depending on whether or not there have been groundbreaking efforts on a mega project or two. The important type-of-structure subcategory of commercial work was flat (0%) month to month in October.
October 2016’s 11.0% performance relative to October 2015 was thanks to a huge percentage uptick in industrial work (477.2%), plus a good increase in institutional (31.1%) and a gentle step forward by engineering (10.7%). Commercial starts, though, disappointed (-15.3%).
With respect to year-to-date starts in 2016 (8.8%), the institutional type-of-structure category (15.7%) has led the way, followed by commercial (11.3%) and heavy engineering/civil (3%). The less prominent category of industrial has fallen off by about one-third (-32.8%).
Delving deeper into the year-to-date statistics, school/college starts account for the largest slice (a 59% share) of institutional work. October was a good month for educational facility starts: 42% month over month (m/m); 35.9% year over year (y/y); and 13.9% year to date (ytd).
The next biggest contributor within the institutional category is hospital/clinic starts (a 15% share). In October, they wandered away from what had been a strong path earlier in 2016 and were -40.3% m/m; -32.9% y/y; but still 17.6% ytd. Thankfully, nursing/assisted living starts sprang forward with exceptional vitality: 92.9% m/m; 89.6% y/y; and 42.4% ytd.
Retail/shopping starts (a 27% share) take pride of place in commercial work and in the latest month, they were an impressive 30.9% m/m; 5.2% y/y; and 27.9% ytd.
Private office starts (a 16% share) faltered in October (-41.3% m/m; -37.3% y/y; 11.8% ytd), but government office starts (an 11% share) came to the rescue (21.2% m/m; 21.3% y/y; and 16.1% ytd).
Hotel/motel starts (a 13% share) were so-so: 2.1% m/m; 58.3% y/y; and 2.2% ytd.
Road/highway starts are dominant (a 43% share) in the heavy engineering type-of-structure category. In the latest month, they perked up a bit: 12.3% m/m; 32.5% y/y; and 4% ytd. While bridge starts (an 11% share) showed mainly consistent improvement during the earlier periods of this year, in October they were -26% m/m; but 38.6% y/y; and 23.1% ytd.
Water/sewage starts (a 25% share) were -22.4% m/m; -5.8% y/y; but 9.8% ytd.
Among the 12-month moving average trend graphs, schools/colleges and bridges have been most clearly moving higher of late, while roads/highways and water/sewage are trying to attain some lift. Retail was skyrocketing but has more recently suffered a setback. Private office buildings and miscellaneous power have taken turns for the worse.
Construction’s sharp compensation increases of 5% and more year over year in September’s Employment Situation Report all but disappeared in October’s update. Including supervisory personnel, average hourly earnings for all jobs was 2.8% y/y. Construction did somewhat better at 3.2%.
With respect to average weekly earnings, however, construction fell behind at 2.4% versus 2.5%. Omitting bosses, average hourly earnings throughout the economy were 2.4%, whereas they were 3.3% for the ‘hard hat’ contingent. But with respect to average weekly earnings, once again construction lost ground, only 1.1% compared with 2.1%.
The value of construction starts each month is summarized from ConstructConnect’s database of all active construction projects in the U.S. Missing project values are estimated with the help of RSMeans’ building cost models.
ConstructConnect’s nonresidential construction starts series, because it is comprised of total-value estimates for individual projects, some of which are ultra-large, has a history of being more volatile than many other leading indicators for the economy.