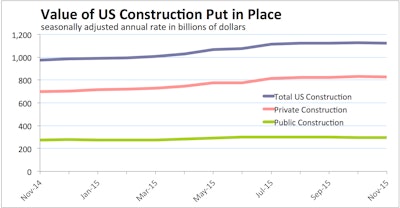
The U.S. Census Bureau of the Department of Commerce estimated that construction put in place in November 2015 slipped 0.4% from October to a seasonally adjusted annual rate of $1,122.5 billion. The November figure is 10.5% above November 2014.
During the first 11 months of 2015, spending on construction put in place amounted to $1,011.9 billion, 10.7% above the same period in 2014.
Private Construction
November spending on private construction in the U.S. slipped 0.2% to a seasonally adjusted annual rate of $828.2 billion.
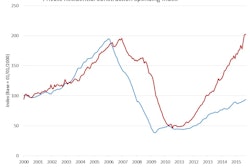
Private residential construction rose 0.3% to a $427.9 billion, and was 10.8% higher than the November 2014 rate.
Private nonresidential construction declined 0.7% for the month to $400.3 billion, but was 13.6% above November 2014.
Spending on manufacturing construction fell 4% to $83.6 billion. But manufacturing construction registered the biggest 12-month spending gain in the private nonresidential construction sector, rising 28.8% over November 2014. Manufacturing construction is the biggest private nonresidential construction pending category.
Status of the other leading private nonresidential construction categories includes:
- Power: down 0.9% to $76.4 billion (5.6% above November 2014)
- Commercial: down 0.9% to $66.6 billion (0.4% below November 2014)
- Office: up 1.7% $51.0 billion (23.1% above November 2014)
Public Construction
November spending on public construction put in place fell 1% for the month to a seasonally adjusted annual rate of $294.3 billion.
Educational construction gained the most in the month for the public sector, rising 5% to $71.2 billion. Public spending on educational construction was 15.1% above November 2014.
The biggest category of public construction spending, highway and street, fell 1.3% for the month to $90.7 billion, but was 5.6% above November 2014.