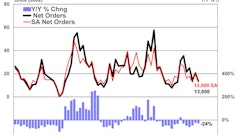
After averaging more than a 1.204-million-unit pace in June and July, U.S. housing starts fell 5.8% in August to a seasonally adjusted annual rate of 1.142 million. Single-family starts dropped 6.0%, while starts of projects with five units or more fell 6.9%.
“Despite the August drop, the recovery in single-family construction remains on track,” assures the Wells Fargo Economics Group in its analysis of the monthly housing construction estimates by the U.S. Census Bureau. “Single-family permits rose 3.7% in August and are now running ahead of starts.
"As far as single-family construction is concerned, builders are selling virtually everything they build," says Wells Fargo Senior Economist Mark Vitner. "There is very little finished inventory available for sale and inventory under construction and not started also remains historically low."
“On a year-to-date basis, single-family construction is continuing at a rate that is 9% higher than this time in 2015,” says the National Association of Home Builders’ Chief Economist Robert Dietz, in the NAHB's Eye on Housing blog.
Dietz attributes a notable portion of the monthly single-family starts decline to flooding in Louisiana, “The South reported a 13% decline in single-family starts on a monthly basis, and production was 14% lower than the August 2015 pace. We should see strengthening single-family construction in the South in the months ahead.”
The South is particularly important to U.S. single-family home production because more than half of the single-family homes in the country are typically built in the region. Comparing the Census Bureau’s un-adjusted single-family starts in the South, year-to-date production is 8.9% ahead of the first eight months of 2015.
Change in Single Family Starts
|
Region |
August 2016 |
August Starts* |
Year to Date* |
|
South |
-13.1% |
370,000 |
+8.9% |
|
West |
+6.3% |
186,000 |
+5.9% |
|
Midwest |
+6.4% |
116,000 |
+13.6% |
|
Northeast |
-13.8% |
50,000 |
+12.7% |
|
U.S. Total |
-6.0% |
722,000 |
+9.1% |
* August starts are seasonally adjusted annual rates. Change in year-to-date starts based on monthly actuals.
Total U.S. multifamily starts dropped 6.9% from July to August, with a steep decline in the Northeast and slip in the West.
Comparing unadjusted multifamily starts history, year-to-date production is just 0.6% ahead of the first eight months of 2015.
Change in Multifamily* Starts
|
Region |
August 2016 |
August Starts |
Year to Date* |
|
South |
-18.0% |
173,000 |
+8.8% |
|
West |
-5.6% |
101,000 |
-0.9% |
|
Northeast |
+24.7% |
91,000 |
-29.5% |
|
Midwest |
+3.8% |
55,000 |
+33.9% |
|
U.S. Total |
+5.8% |
420,000 |
+0.6% |
* Multifamily starts here include any building that comprise two or more housing units. Change in year-to-date starts based on monthly actuals.
“Permit activity, combined with rising home builder market confidence, suggest gains ahead for starts,” says Dietz. “Single-family permits were up almost 4% in August from the July level. Single-family permits have grown by more than 8% on a year-to-date basis. Multifamily activity continues to level off, with permits down 8% in August and down 15% on a year-to-date basis.”


![[VIDEO] Fair Labor Standards Act Reduced Exemptions Raising Questions](https://img.forconstructionpros.com/files/base/acbm/fcp/image/2016/09/default.57ebc6d6e1e48.png?auto=format%2Ccompress&fit=crop&h=75&q=70&w=75)