June construction starts, excluding residential activity, fell -13.7% versus May, according to ConstructConnect. The usual May-to-June change, due to seasonality, is +4.5%.
June of this year versus a strong June of last year was -16.3%. Standalone June of this year versus June’s average level over the previous five years (2012-2016 inclusive), however, was a more upbeat +2.8%.
Year-to-date starts through the first half of this year, compared with January-to-June of last year, stayed positive at +2.4%.
The starts figures throughout this report are not seasonally adjusted (NSA). Nor are they altered for inflation. They are expressed in what are termed "current" as opposed to "constant" dollars.
Nonresidential building plus ‘engineering/civil’ work accounts for a considerably larger share of total construction than residential activity. The former’s combined proportion of total put-in-place construction in the Census Bureau’s May report was 57%; the latter’s was 43%.
ConstructConnect’s construction starts are leading indicators for the Census Bureau’s capital investment or put-in-place series. Also, the reporting period for starts (i.e., June 2017) is one month ahead of the reporting period for the investment series (i.e., May 2017.)
According to the latest Employment Situation Report from the Bureau of Labor Statistics (BLS), the total number of jobs in construction climbed by 16,000 in June. The monthly average rise in on-site work so far this year has been 19,000, almost double the pace of 10,000 set in last year’s first half.
Among industrial sectors, construction is tied with professional and business services for best year-over-year percentage change in jobs, 3.1%. The 1.6% performance for all jobs in the economy is only about half as quick.
Construction’s NSA unemployment rate in June was an exceedingly low 4.5%. In May, it had been 5.3% and in June 2016, 4.6%.
Employment in architectural and engineering services rose by 5,000 jobs in June, yielding a year-over-year pickup of 3.8%. Healthy hiring by the design professions is a positive leading indicator for construction. Turning owners’ capital spending wishes into visualizations and then creating assembly instructions are crucial first steps prior to work proceeding at jobsites.
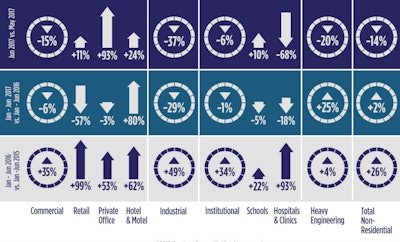
There were nothing but declines month to month (m/m) in all four major type-of-structure subcategories. Industrial dipped the most (-36.7%), followed by heavy engineering/civil (-19.8%). Commercial also exhibited weakness (-14.8%), while institutional (-5.5%) retreated the least.
In a comparison of June 2017 with June 2016 (y/y), there was one subcategory that managed a confident forward stride, engineering at 16.3%. The others, though, took backwards steps progressing from -11.8% for institutional, -27.2% for industrial and -40.8% for commercial.
First-half 2017 versus first-half 2016 starts (i.e., year-to-date or ytd starts) have swung from a high of 25.2% for heavy engineering/civil to a low of -29.1% for industrial, with commercial (-5.6%) and especially institutional (i.e., a nearly flat -0.9%) in the middle. Road/highway starts have accounted for the largest slice (42%) of engineering work so far this year.
In June, the streets component was disappointing m/m (-25.5%), but encouraging both y/y (+16.4%) and ytd (+17.1%). A closely related category is bridges, and in the latest month it too was down m/m (-31.8%), but it was even more bullish y/y (+34.7%) and ytd (+64.9%).
Bridges, with a 16% share, is the third largest portion of engineering. Second place belongs to water/sewage (21%). Water/sewage starts in June were up across the board, although in two instances, only barely: +0.4% m/m; +13.7% y/y; and +1.0% ytd. And before leaving engineering, miscellaneous civil starts (e.g., power-related and oil and gas) should also be mentioned. They’ve recently cast quite a bright light: +27.4% m/m; +33.5% y/y; and +33.9% ytd.
Among subcomponents, schools/colleges contribute the most (i.e., 57%) to institutional starts, by far. The time-comparisons of groundbreakings on education facilities in June were mixed, with an upward lift m/m (+9.6%) tempered by downdrafts y/y (-4.9%) and ytd (-5.0%). Hospital/clinic work is second most important in institutional (with a 15% share) and in the sixth month of this year, medical facilities did nothing but drag their feet: -67.6% m/m; -67.9% y/y; and -17.9% ytd.
Moving in the other direction, the fire/police/courthouse/prison catch-all category in June was +71.4% ytd, led by courthouses (+232.0% ytd) and prisons (+42.2% ytd).
Within commercial starts, hotel/motel work (a 23% slice) has stayed buoyant through this year’s mid-point: +24.1% m/m; +40.1% y/y; and +80.2% ytd. Private office buildings (a 20% share of commercial) haven’t fared as well. While they leapt +93.2% m/m, they were -40.2% y/y and -2.9% ytd.
Retail/shopping starts in June pulled ahead moderately m/m (+11.0%), but they were down steeply both y/y (-74.8%) and ytd (-57.2%). Warehouse starts faltered m/m (-31.4%) and y/y (-20.6%), but they remained on the plus side of the ledger ytd (+30.3%). An impressive +43.4% change for miscellaneous commercial ytd is a combination of -26.9% ytd for transportation terminals being more than offset by +92.8% for sports stadiums.
As for year-over-year compensation levels in June, as reported by the BLS in the latest Employment Situation Report, there wasn’t much difference between all workers and those engaged in construction. Including supervisory personnel, year-over-year average hourly and average weekly earnings economy-wide were +2.5% and +2.8% respectively. The comparable figures in the construction sector were +2.5% and +2.7%.
Excluding bosses, the all jobs earnings increases, on average, were +2.3% hourly and +2.6% weekly. For hard hat workers, the gains were +2.3% both hourly and weekly.
The value of construction starts each month is summarized from ConstructConnect’s database of all active construction projects in the U.S. Missing project values are estimated with the help of RSMeans’ building cost models. ConstructConnect’s nonresidential construction starts series, because it is comprised of total-value estimates for individual projects, some of which are ultra-large, has a history of being more volatile than many other leading indicators for the economy.