After beginning the year with a marginal decline, the Architecture Billings Index (ABI) has posted three consecutive months of growth in design revenue at architecture firms. As a leading economic indicator of construction activity, the ABI reflects the approximate nine- to 12-month lead time between architecture billings and construction spending.
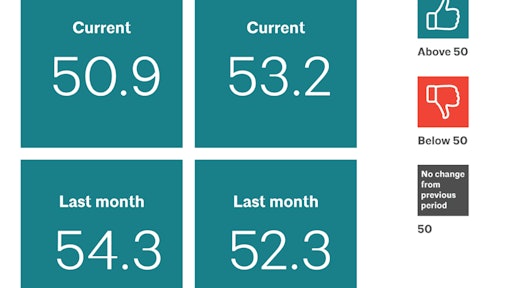
The American Institute of Architects (AIA) reported the April ABI score was 50.9, down from a score of 54.3 in the previous month. While fewer firms reported billings growth in April compared to March, this score still reflects an increase in design services (any score above 50 indicates an increase in billings). Firms indicated that plenty of work remains in the pipeline, though, as inquiries into new projects and the value of new design contracts both increased again in April.
The new projects inquiry index was 60.2, up from a reading of 59.8 the previous month, while the new design contracts index increased from 52.3 to 53.2.
“Probably even better news for the construction outlook is that new project work coming into architecture firms has seen exceptionally strong growth so far this year,” said AIA Chief Economist, Kermit Baker, Hon. AIA, PhD. “In fact, new project activity has pushed up project backlogs at architecture firm to their highest level since the design market began its recovery earlier this decade.”
Business conditions also improved at firms in all regions of the country in April, marking only the second time in the last 12 months that this has occurred. Billings growth was strongest at firms located in the Midwest and South, while growth tended to be more modest at firms in the rest of the country.
Firm billings also grew at firms of all specializations this month, with the exception of a very modest decline for those with a residential specialization. On the other hand, firms with an institutional specialization have seen particularly strong growth in billings over the last several months.
Key April ABI highlights:
The regional and sector categories are calculated as a three-month moving average, whereas the national index, design contracts and inquiries are monthly numbers.
Regional averages:
- South (55.3)
- Midwest (53.3)
- West (50.9)
- Northeast (50.7)
 American Institute of Architects
Sector index breakdown:
- Institutional (54.0)
- Mixed practice (53.4)
- Commercial / industrial (52.4)
- Multifamily residential (49.9)
 American Institute of Architects