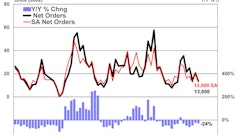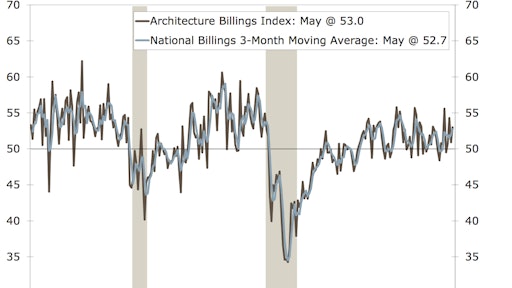
Design services at architecture firms continue to project a healthy disposition on the construction industry as the Architecture Billings Index (ABI) recorded the fourth consecutive month of growth. As a leading economic indicator of construction activity, the ABI reflects the approximate nine to 12 month lead time between architecture billings and construction spending.
The American Institute of Architects (AIA) reported the May ABI score was 53.0, up from a score of 50.9 in the previous month. This score reflects an increase in design services (any score above 50 indicates an increase in billings). The new projects inquiry index was 62.4, up from a reading of 60.2 the previous month, while the new design contracts index increased from 53.2 to 54.8.
“The fact that the data surrounding both new project inquiries and design contracts have remained positive every month this year, while reaching their highest scores for the year, is a good indication that both the architecture and construction sectors will remain healthy for the foreseeable future,” AIA Chief Economist, Kermit Baker, Hon. AIA, PhD. “This growth hasn’t been an overnight escalation, but rather a steady, stable increase.”
Key May ABI highlights:
Regional averages were a mixed bag. The South and West regions both experienced increases for the month of May. The South was at 56.1, up from 55.3 last month. The West came in at 52.3, up from 50.9 in April. The Northeast dropped to 46.5 in May compared to a 50.7 April reading. The Midwest dropped from 53.3 in April to 50.4 in May.
Broken down by sector, mixed practice and multifamily residential both saw increases while commercial/industrial and institutional both experienced decreases.
Mixed practice was at 55.8 in May, up from 53.4 in April. Multifamily jumped from 49.9 in April to 51.3 in May.
Commercial/industrial dropped just over one point from 52.4 to 51.2 in May while institutional dropped nearly three points from 54.0 to 51.2 in May.
The regional and sector categories are calculated as a 3-month moving average, whereas the national index, design contracts and inquiries are monthly numbers.


