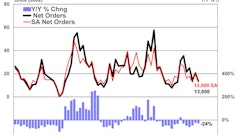
For the sixth consecutive month, architecture firms reported increasing demand for design services as reflected in the July Architecture Billings Index (ABI). The American Institute of Architects (AIA) reported the July ABI score was 51.9, down from a score of 54.2 in the previous month. This score still reflects an increase in design services (any score above 50 indicates an increase in billings). The new projects inquiry index was 59.5, up from a reading of 58.6 the previous month, while the new design contracts index increased from 53.7 to 56.4.
As a leading economic indicator of construction activity, the ABI reflects the approximate nine- to 12-month lead time between architecture billings and construction spending.
“The July figures show the continuation of healthy trends in the construction sector of our economy,” said AIA Chief Economist, Kermit Baker, Hon. AIA, PhD. “In addition to the balanced increases in design billings across all major regions and construction sectors, the strong gains in new project work coming into architecture firms points to future growth in design and construction activity over coming quarters.”
All regions experienced gains in design services demand. The South and Midwest registered 53.8 on the ABI while the Northeast was at 53.6 and the West at 50.9. Both the Midwest and the Northeast registered higher averages compared to June. In June, the Midwest was at 51.9 while the Northeast was at 51.5.
The South and West registered lower averages in July but still reflected an increase in billings. The South was at 54.8 in June while the West was 53.1.
All major sectors also experienced gains with multifamily residential at 55.8, commercial/industrial at 55.4, institutional at 52 and mixed practice at 48.4. The institutional and commercial/industrial sectors had an ABI score lower in July compared to June. Last month, institutional came in at 52.6 and commercial/industrial at 52.1.
Also in June, multifamily residential registered at 57.1 and mixed practice at 53.8.
The regional and sector categories are calculated as a 3-month moving average, whereas the national index, design contracts and inquiries are monthly numbers.