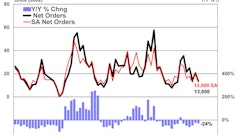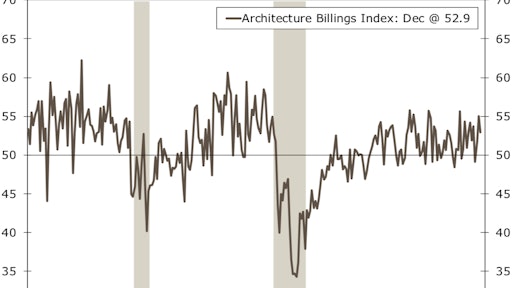
The Architecture Billings Index (ABI) concluded 2017 in positive terrain, with the December reading capping off three straight months of growth in design billings. The American Institute of Architects (AIA) reported the December ABI score was 52.9, down from a score of 55.0 in the previous month. This score still reflects an increase in design services provided by U.S. architecture firms (any score above 50 indicates an increase in billings). The new projects inquiry index was 61.9, up from a reading of 61.1 the previous month, while the new design contracts index decreased slightly from 53.2 to 52.7.
“Overall, 2017 turned out to be a strong year for architecture firms. All but two months saw ABI scores in positive territory,” said AIA Chief Economist, Kermit Baker, Hon. AIA, PhD. “Additionally, the overall strength of the fourth quarter lays a good foundation for healthy growth in construction activity in 2018.”
In regards to regional averages, in December the South came in at 56.3, the West at 53.0, the Midwest at 52.9 and the Northeast at 49.4. The South and Midwest both had ABI scores higher than in November while the December ABI scores were lower in the West and Northeast compared to November.
All four sectors in the index were in positive territory in December. Multi-family residential was at 55.4, commercial/industrial was 54.8, institutional was at 51.2 and mixed practiced came in at 50.4. Multi-family residential and commercial/industrial sectors both had higher readings in December compared to November. Institutional and mixed practices were both lower in December compared to November.
The regional and sector categories are calculated as a 3-month moving average, whereas the national index, design contracts and inquiries are monthly numbers.