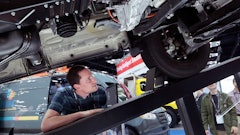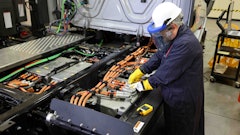
Driver safety is a concern for any company that has vehicles on the road. In addition to the conduct of the drivers themselves and their interactions with those around them, there is concern about how bad driver behavior might be perceived by the public. One Georgia contractor operates an asphalt plant for its paving projects and others’ projects. It also has a division that engages in heavy civil construction projects. It uses telematics to rein in driver behavior. Here’s how they use the technology to reduce incidents of speeding (relative to the posted speed limit), hard braking, fast starts and hard turns among their fleet of 150 on-road vehicles.
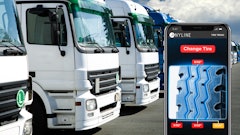
Vehicle data is captured from either a telematics app or an in-vehicle device.
“We have about 400 devices installed (150 of which are on-road vehicles); all … were done in-house by our own mechanics. Most are hardwired, but we use the ODB-2 port on anything we can. The only vehicles we use the ‘app as a device’ for are when third-party haulers are hauling on our projects. That way, we have 100% of trucks accounted for on our shifts,” said the business process manager (BPM) for the contractor.
This data, which is reported continuously, is used to assign a numeric score and a letter grade to each driver. The fleet monitoring system tabulates the data into a report that is distributed weekly to key company personnel.
“The president will [review] the report to see who the biggest group of offenders are and then call their supervisors. ‘This person is not driving great; here’s what they need to improve on. Please talk with them,’” said the BPM.
“We had one person who was driving a heavier vehicle who had earned an F the previous week,” he continued. “So, we had a serious talk with him. The next week, he went from an F to an A-, so we had a lighter talk with him. ‘You did great last week, we’re all proud of you, keep it up.”
“We may not have ever known about this driver’s habits without [the telematics system]. We first tested the device to make sure everything was calibrated correctly. Then after confirming the device was correct, sat him down and talked about the responsibility associated with driving. We let him know we would be watching for an improvement and gave him tips to think about based on the habits [the data] revealed (for example, leaving more space than he thinks he should to give ample brake distance because [the telematics] pointed out the harsh braking events). After that, his score steadily improved.”
 The software calculates each driver's average score. Editor's note: The drivers' names have been concealed.Fleetwatcher
“A big part of this was our commitment to improve. [The telematics system] gave us the tools to see what was happening and to hold drivers accountable.”
If You Can Measure It, You Can Improve It
In addition to the driver safety reports that are generated, the BPM also takes a deeper dive into the data using data visualization software to help his team better think about the data.
“Every Monday, I run the driver safety leaderboard report then take the CSV export and save it to a file folder. Then [the visualization software] will pick it up and make the dashboard, which is a four-page report.” The data, which is reported continuously, is used to assign a numeric score and a letter grade to each driver. The fleet monitoring system tabulates the data into a report that is distributed weekly to key company personnel. Editor's note: The driver's names have been concealed.Fleetwatcher
The first page is exactly like the driver safety leaderboard. Every driver receives a numeric score based on their driving performance for the past week—based on the four criteria monitored. Drivers and their scores are listed in descending numerical order, with the best driver’s score at the top and the worst at the bottom. In addition to a numeric score, each driver’s score bar chart is color-coded for easy identification. Anything above 60 is blue and anything less than 60 is red. Drivers with red color bars are typically selected for personal discussions.
The next page of the report lists the infraction type average per driver.
 The fleet management software keeps up with each driver's infractions. Editor's note: The drivers' names have been concealed.Fleetwatcher
The BPM can look at all drivers to see how many infractions they have and see who’s the biggest risk and then act to counsel drivers as needed.
The next page of the report is a pie chart showing every driver and every infraction and what the distribution is. The BPM can look at the company to see what the most common infraction is.
“If we’re trying to cut back on something, this is where we would find the biggest influencer,” he said.
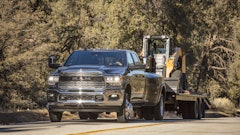
 The contractor uses telematics to rein in driver behavior and reduce incidents of speeding, hard braking, fast starts and hard turns.Fleetwatcher
Overall, the company has noticed an improvement in driver behavior. In fact, the BPM commented that in the asphalt paving business driver behavior has improved across the board without any driver discussions. “We had not spoken with the dump truck drivers that haul mix and aggregate, but their scores improved as a whole. Every single one of them improved over time.”
Perhaps it was because they sign in to the fleet management system every day and know that they are being monitored.
“I don’t know if putting their name on the vehicle was the cause (for the improvement) but every single driver was already great or improved to an A or a B,” the BPM said. “It also helped us weed out a driver that wasn’t going to cut it.”
Does Proper Spacing Eliminate the Rush?
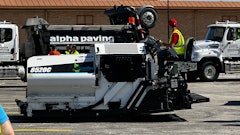
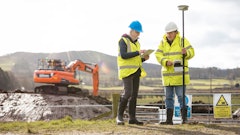
Another possible reason for the driver behavior improvements could lie with the visibility that the telematics system provides across the whole fleet, as evidenced by a paving project along U.S. Highway 27. The project was a straightforward mill and overlay job covering all four lanes of U.S. 27 in each direction. In addition, there was a bidirectional turn lane in the middle, along with some median work and some patchwork, but the majority was mill and overlay. The project required 30,000 tons of material, including base, binder and topping. With heavy traffic in some sections, keeping trucks properly spaced with minimal waiting was a challenge. Here’s how they did it.
Roughly 2 years ago the company implemented the materials management system (MMS) telematics platform. Specifically designed for asphalt paving contractors, MMS provides real-time visibility to all the company’s paving assets. Managers, supervisors and other users can see:
- How many trucks are allocated to a specific job
- Where they are
- When the trucks are due to arrive at the paver (or return to the asphalt plant)
If there is a traffic tie-up that is causing problems, the dispatcher can alert trucks to take an alternate route around the problem area, saving valuable time. The BPM of the company especially appreciates the load cycle analysis (LCA) screen that quickly shows him how the trucks are spaced—and whether they are bunched or staggered.
“Being able to see every single truck on a shift and seeing whether they are in a stair-step pattern at a glance so valuable,” the BPM said.
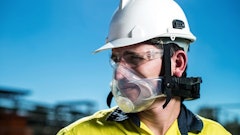
In addition to monitoring trucks and taking corrective action in real-time, this facility uses the active idle alert feature. If any monitored piece of equipment idles for more than a company-set time (which varies by equipment type), the supervisor receives an email alert. If the idling continues for long enough, the supervisor gets another alert as does the manager. As the idling continues, the alerts escalate up the corporate ladder—but usually, one or two alerts are all that is needed to get the asset back into productive mode.
He recalled a time on the Highway 27 project when “my inbox was blowing up. We were getting flooded with alerts from the paver, which sends an alert about every 30 seconds. I looked at the LCA and saw that we had a bottleneck at the paver—so I called the foreman on site. Turns out the paver had a problem and was down for about 20 minutes.”
Rather than continuing to send trucks to wait in the line that was forming, the dispatcher redirected several trucks to other projects.
 In addition to monitoring trucks and taking corrective action in real-time, this facility uses the active idle alert feature. If any monitored piece of equipment idles for more than a company-set time (which varies by equipment type), the supervisor receives an email alert.Fleetwatcher
“It’s a report we run every morning so we can look at yesterday’s shifts before we start the new day and hopefully make corrections. Maybe we had too many trucks yesterday. Let’s pull one off today and see how it works.”
Whether trucks are evenly spaced using the LCA and therefore aren’t rushing around, or driver behavior improves from counseling, or there is some of the “Hawthorne Effect” of improvement because drivers know they are being watched, this contractor is clearly happy with the results.
“Being able to ensure that smooth stair step desired in the LCA has been huge for us. And the driver safety has also been a smooth and impactful feature of [the fleet management system] for us.”