April construction starts, excluding residential activity, were -7% versus March. The usual seasonal pattern is for a 12% increase month to month at this time of year, as blustery winter mellows into gentler spring.
Compared with April of last year, April this year was -22.8%. But April of last year was exceptionally strong. It was the most buoyant month in 2016 and higher by one-third than the average of all months in the last full year.
April of this year compared with average April results over the prior five years, 2012- 2016, was +17.6%. Year-to-date starts so far in 2017 have been -2% compared with the same first four months of last year.
The starts figures throughout this report are not seasonally adjusted (NSA). Nor are they altered for inflation. They are expressed in what are termed ‘current’ as opposed to ‘constant’ dollars.
Nonresidential building plus engineering/civil work accounts for a considerably larger share of total construction than residential activity. The former’s combined proportion of total put-in-place construction in the Census Bureau’s March report was 57%; the latter’s was 43%.
ConstructConnect’s construction starts are leading indicators for the Census Bureau’s capital investment or put-in-place series. Also, the reporting period for starts (i.e., April 2017) is one month ahead of the reporting period for the investment series (i.e., March 2017.)
The NSA jobless rate in construction improved from 8.4% in March to 6.3% in April, according to the latest Employment Situation Report from the Bureau of Labor Statistics (BLS). Job creation in the sector in the latest month was a tepid +5,000 after an even weaker +1,000 in March. The pace of hiring in construction has slowed dramatically from January’s +34,000 and February’s +54,000.
The year-over-year change in employment in construction is now +2.6%, which is faster than for all jobs in the economy, +1.6%. Relative to other major industrial sectors, however, construction’s +2.6% is slower than for first-place ‘professional and business services’, at +3.1%, and is only a little ahead of third-place ‘education and health’s’ +2.3%.
Work carried out by the design professions is a leading indicator for on-site construction activity and it is encouraging to note that year-over-year employment by architectural and engineering firms in April was +3.5%. Hiring by the real estate sector, which includes developers, was +3% year over year.
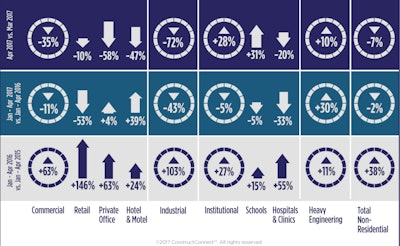
April’s month-to-month (m/m) drop in starts (-7.2%) was a mix of big declines in industrial (-72%) and commercial (-35.4%), but almost compensating gains in civil (+10.4%) and institutional (+27.9%). Worth noting is that industrial is a smaller-volume category than the other three and it can display extreme percentage-change volatility brought on by the presence or absence of a mega project or two.
The April-2017-over-April-2016 (y/y) performance of starts (-22.8%) featured only one increase among major subcategories, heavy engineering/civil at +21.9%. Industrial was -92%; commercial, -37.2%; and institutional, a moderate -3.6%.
 The April-2017-over-April-2016 performance of starts (-22.8%) featured only one increase among major subcategories, heavy engineering/civil at +21.9%. Industrial was -92%; commercial, -37.2%; and institutional, -3.6%.ConstructConnect
The shallow decline (-1.6%) in year-to-date (ytd) starts so far in 2017 (i.e., versus January to April 2016), has been due to pull-backs in industrial (-43.4%), commercial (-11.1%) and institutional (-5.2%), while heavy engineering (+29.7%) has nearly saved the day.
Through April, the largest sub-component of engineering starts has been road/ highway work, with a 37% share. There has been a nice pickup in street starts across the board: +20.8% m/m; +19.1% y/y; and +12.9% ytd.
Second most important among civil work, with a 21% slice, has been the water/sewage category, which has turned in a more varied record: +44.7% m/m; and +7.9% ytd; but -16.8% y/y.
Mention should also be made of bridge starts in the engineering category. Although -27.9% m/m in April, they were +63.8% y/y and +61.4% ytd.
As per usual, institutional starts so far this year have been dominated by the school/ college subcategory (an outsized 58% share). Educational facility starts in the latest month were +30.6% m/m; but -8.2% y/y; and -5.3% ytd.
Hospital/clinic starts (with a 13% share) have claimed the runner-up position in the institutional category and they have been struggling: -20.2% m/m; -40.9% y/y; and -32.9% ytd.
A subcategory of institutional work that has been a standout so far in 2017 has been fire/police/courthouse/ prisons. Driven mainly by courthouses and prisons, this subset has more than doubled m/m (+142.4%); y/y (+117.5%); and ytd (+121.4%).
Private office buildings clung to top spot (with a 23% share) among commercial subcategories in April, even though they were -57.8% m/m and -51% y/y. On a year-to-date basis, they continued positive, +3.7%.
Second-ranking hotels/motels (with a 19% share) were solidly ahead ytd (+38.9%), despite retreating noticeably both m/m (-47.3%) and y/y (-15.3%). Retail/shopping and warehouse starts each accounted for 13% of the commercial category and while the former was uniformly gloomy (-10% m/m; -62.9% y/y; and -52.5% ytd), the latter was more upbeat (-49.3% m/m; but +19% y/y; and +52.8% ytd).
The 12-month moving average trend graphs on page four show non-residential building starts in a bit of a tailspin, being led down by retail and hospitals/clinics especially. But heavy engineering appears to be embarking on an upward path, propelled by roads/ highways, bridges and miscellaneous power (which includes oil and gas projects as well as electricity generation).
 The 12-month moving average trend graphs show nonresidential building starts in a bit of a tailspin, being led down by retail and hospitals/clinics, but heavy engineering appears to be embarking on an upward path.ConstructConnect
Average weekly earnings among non-supervisory construction workers in April crossed above the +3% threshold to reach +3.3%. Average hourly earnings in the sector were +2.5%. The all-jobs increases for the economy as a whole weren’t quite as favorable: +2.6% and +2.3% for average weekly and average hourly earnings respectively.
The value of construction starts each month is summarized from ConstructConnect’s database of all active construction projects in the U.S. Missing project values are estimated with the help of RSMeans’ building cost models.
ConstructConnect’s nonresidential construction starts series, because it is comprised of total-value estimates for individual projects, some of which are ultra-large, has a history of being more volatile than many other leading indicators for the economy.