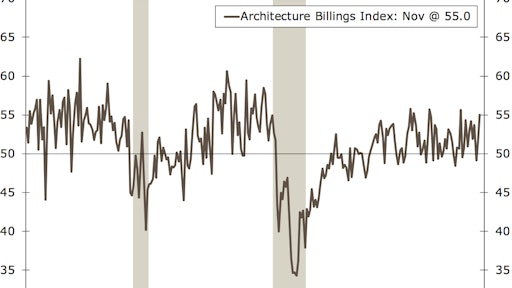
Even with the uncertainty related to pending tax reform legislation that likely will have a mixed effect on the construction industry, design services at architecture firms remains in high demand. The American Institute of Architects (AIA) reported the November Architecture Billings Index (ABI) score was 55.0, up from a score of 51.7 in the previous month. This score reflects an increase in design services provided by U.S. architecture firms (any score above 50 indicates an increase in billings). The new projects inquiry index was 61.1, up from a reading of 60.2 the previous month, while the new design contracts index rose slightly from 52.8 to 53.2.
“Not only are design billings overall seeing their strongest growth of the year, the strength is reflected in all major regions and construction sectors,” said AIA Chief Economist, Kermit Baker, Hon. AIA, PhD. “The construction industry continues to show surprising momentum heading into 2018.”
Regionally, the West registered 54.8 on the ABI, the Northeast and South came in at 52.8, and the Midwest was at 50.4. The Northeast was the only region that had a down reading compared to the October ABI. In October, the Northeast was at 54 on the ABI. Last month the South came in at 50.8, the West at 49.8 and the Midwest at 49.
All the sectors registered above 50 on the ABI as well. Multifamily residential came in at 53.9 an increase from the 50.7 reading in October. Mixed practice was at 53.6, an increase from 50.7 last month. Commercial/industrial was at 53.3, an increase rom its previous reading of 51.2. Institutional was at 52.4 in November, an increase from 50.7 in October.
The regional and sector categories are calculated as a 3-month moving average, whereas the national index, design contracts and inquiries are monthly numbers.

![Brian Bieller Release[86]](https://img.forconstructionpros.com/files/base/acbm/fcp/image/2023/05/Brian_Bieller_Release_86_.644feae4055af.png?auto=format%2Ccompress&fit=crop&h=191&q=70&rect=0%2C159%2C1920%2C1080&w=340)