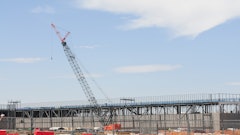
Fatal work injuries in the private construction sector increased 5 percent to 775 in 2012, while total hours worked in the industry increased just one percent.
The 2012 increase in fatal occupational injuries follows five consecutive years of declining fatalities in construction. Fatal construction injuries are down 37 percent since 2006.
The reversal in construction's worker-fatality trend is stark in light of the fact that the 2012 fatal-work-injury count for all U.S. employers is down 6.6 percent to the second-lowest total since the U.S. Bureau of Labor Statistics first started conducting the Census of Fatal Occupational Injuries in 1992
The rate of fatal work injury for all U.S. workers in 2012 was 3.2 per 100,000 full-time equivalent workers, down from a rate of 3.5 per 100,000 in 2011. There were 9.5 U.S. construction-worker deaths in 2012 per 100,000 full-time workers.
National Census of Fatal Occupational Injuries in 2012 (preliminary results)


