According to CMD, July’s level of total construction starts in the U.S., excluding residential work, was $22.4 billion, a drop of 27.7% compared to June. The major retreat was more noteworthy given CMD’s long-term June-to-July percentage change, due to seasonality, of 3.5%. It’s worth noting, however, that the June-to-July shift last year was also weak, -19.8%.
July’s starts level was a return to slightly above the $21.7 billion average over the first four months of this year. Only May, at $31.4 billion, and June, at $31 billion, have been significantly better than the norm so far in 2015. May was 43.3% month over month while June was -1.1%.
The individual month of July’s starts level this year relative to the same month last year was -11.9%. Year-to-date starts in 2015 have been -1.3% relative to the same January-to-July period in 2014.
The starts figures throughout this report are not seasonally adjusted (NSA). Nor are they adjusted for inflation. They are expressed in what are termed ‘current’ as opposed to ‘constant’ dollars.
‘Non-residential building’ plus ‘engineering/civil’ work accounts for a considerably larger share of total construction than residential activity. The former’s combined proportion of total put-in-place construction in the Census Bureau’s June report was 64%; the latter’s was 36%.
CMD’s construction starts are leading indicators for the Census Bureau’s capital investment or put-in-place series. Also, the reporting period for starts (i.e., July 2015) is one month ahead of the reporting period for the investment series (i.e., June 2015.)
In its July Employment Situation report, the Bureau of Labor Statistics (BLS) records a total construction employment increase of 6,000 jobs month over month, after no change in June. The year-over-year gain has been 231,000 jobs. 2015’s year-to-date improvement has been 108,000.
On a percentage-change basis, total non-farm employment in July was 2.1%. Construction’s pace of change was speedier by nearly double, 3.8%. The unemployment rate in construction in July was a commendably low 5.5% (not seasonally adjusted). A year ago, it had been 7.5%.
Before there can be on-site construction activity, projects must be contemplated and planned by owners and rendered into working drawings by design professionals. Year-over-year employment in architectural and engineering services in July was a strong 3.6%. If the current trend continues, total employment in the sector will catch up with its pre-recession peak this fall.
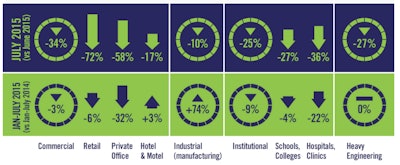
July’s month-to-month starts in all three major type-of-structure categories were down between one-quarter and one-third. Commercial (-34%) led the decline, but heavy engineering (-27.2%) and institutional (-24.6%) also suffered substantial losses. The smaller category of industrial starts (-9.8%) registered a drop as well, but not to the same painful degree.
Comparing this year’s standalone month of July with the same seventh month of last year, the civil/engineering category (-25.5%) stayed depressed, but the declines in commercial (-3.3%) and institutional (-10.6%) were less severe.
Industrial starts (525%) picked up nicely, although off a minimal base. July 2014’s figure (i.e., the denominator) was quite low. Furthermore, the percentage change for industrial work can often display a sizable fluctuation depending on whether or not a ‘go-ahead’ has been granted for a large project or two.
As for year-to-date starts, the flat performance in heavy engineering (0%) in July beat second-place commercial (-3%) and third-place institutional (-9%). Only industrial (74.3%) advanced.
Within engineering starts, the biggest subcategory, by far (i.e., with nearly half the year-to-date dollar volume), is roads/highways, which was -30.6% month to month (m/m); -28.7% when compared with July of last year (y/y); but 3.8% on a year-to-date basis (ytd) relative to the same January-to-July time frame of 2014. Next-in-line, water/sewage work was negative on all three counts: -23.5% m/m; -12.5% y/y; and -5% ytd.
Within institutional work, the current year-to-date dollar volume of educational facility starts exceeds health care projects by more than five times. Schools/colleges in July were -27.3% m/m; -15% y/y; but a less-rapidly-diminishing -4.1% ytd. Not all has been bleak, however. Elementary/pre-school starts have been +6.7% ytd.
Hospital/clinic starts in July were: -35.7% m/m; +4.7% y/y; and -22.2% ytd. More optimistically, police/courthouse/prison starts were: 111% m/m; 277.5% y/y; and 80.7% ytd. On a sub-aggregate level, courthouses were 48.4% ytd and prisons, 256.7% ytd.
In commercial starts, the retail category is a key component. Unfortunately, its July numbers plummeted: -72.3% m/m; -50.6% y/y; but a not-quite-so-bad -6.4% ytd. Private office buildings were also in distress: -58.3% m/m; -49% y/y; and -32.4% ytd. Government office buildings tried to come to the rescue: 67.7% m/m; 15.4% y/y; although -10.9% ytd.
Warehouse starts were another bright spot: 59.9% m/m; 258.2% y/y; and 8.8% ytd. Also, within ‘miscellaneous commercial’ is the sub-category sports/convention centers, which was 89.1% ytd.
With the exception of the private office buildings curve, which is slipping markedly, most of the 12-month moving average trends have been leveling off of late.
Analysts are keeping a sharp eye out for supply bottlenecks in labor markets. As soon as these develop, there will be evidence in escalating earnings. So far, though, wages and salaries have stayed restrained.
July’s Employment Situation report from the BLS shows total private-sector average hourly earnings up 2.1% year over year. Weekly earnings are ahead by 2.4%. For all construction workers, hourly earnings have risen faster, 2.6%, but weekly earnings slower, 1.8%.
The value of construction starts each month is summarized from CMD’s database of all active construction projects in the U.S. Missing project values are estimated with the help of RSMeans’ building cost models.
CMD’s nonresidential construction starts series, because it is comprised of total-value estimates for individual projects, some of which are mega-sized, has a history of being more volatile than many other leading indicators for the economy.
A “start” is determined by taking the announced bid date and adding a short time lag (30 to 60 days). CMD continues to follow the project via its network of researchers. If it is abandoned or re-bid, the start date is updated to reflect the new information.