August’s level of total U.S. construction starts, excluding residential work, was $19.8 billion, a drop of 24.7% versus July, according to a new report from CMD. Standalone August’s starts level this year relative to the same month last year was -35.1%. Year-to-date starts in 2015 have been -1.8% versus the same January-to-August period in 2014.
Average year-to-date monthly starts through August were $25 billion, pulling back from the January-through-July average of $25.8 billion
The starts figures throughout this report are not seasonally adjusted (NSA). Nor are they adjusted for inflation. They are expressed in what are termed ‘current’ as opposed to ‘constant’ dollars.
‘Nonresidential building’ plus ‘engineering/civil’ work accounts for a considerably larger share of total construction than residential activity. The former’s combined proportion of total put-in-place construction in the Census Bureau’s August report was 64%; the latter’s was 36%.
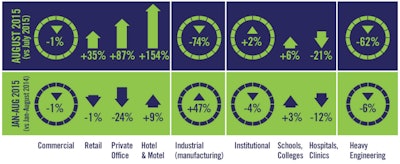
Among the three major sub-categories of nonresidential construction, the most dramatic change month-to-month in August — by far — occurred in heavy engineering, a plunge of 62.1%. The two biggest components of civil/engineering are road/highway and water/sewage work, and they both suffered severe setbacks, -63.4% and -51.3% respectively.
The month-to-month movements in commercial and institutional were little more than sideways, -1% and +2% respectively. Industrial starts (-73.9%) fell by nearly three quarters, but its dollar volume is usually much lower than for the other categories and its percentage change can be inordinately influenced by go-aheads for one or two mega projects in any specific month.
As for this year’s individual month of August versus the same eighth month of last year, engineering/civil starts (-67.5%) were again down the most, but commercial (-12.9%) and institutional (-12.7%) also experienced notable declines and to almost the same degree.
In year-to-date starts, commercial (-0.7%) has almost held its own, institutional (-3.5%) has declined slightly, while heavy engineering (-6.3%) has retreated the most. Industrial (+46.6%), thanks to some outsized groundbreakings earlier this year, has risen by nearly half.
While road/highway starts within engineering may be lower by -63.4% month to month (m/m) and -68.6% year over year (y/y), they are considerably less negative year to date (ytd), -5.1%.
Clearly apparent, though, is a need for Washington to set a more assured and predictable financing framework for infrastructure projects. The uncertainty arising from stop-gap measures to augment revenue shortfalls is playing havoc with the planning and scheduling of projects.
Water and sewage work saw big declines of -51.3% m/m and -47.8% y/y; but a smaller drop of only -3.7% ytd. Bridge work displayed a similar pattern: -57.0% m/m; -55.3% y/y; but a hardly significant -0.1% ytd.
Acting as a drag on institutional were hospital clinic starts (-20.9% m/m; -6.8% y/y; and -12.1% ytd); but the ‘nursing/assisted living’ sub-category was able to claw back some of those losses (+59.1% m/m; -12.6% y/y; and +23.1% ytd.) School/college starts, accounting for almost two-thirds of all institutional groundbreakings, stayed solid (+6.3% m/m; -9.8% y/y; and +2.5% ytd).
Within commercial, the important retail category was largely upbeat: +35.4% m/m; +12.5% y/y; but -1.3% ytd. Private offices were buoyant m/m (+87.2%), but disappointing y/y (-15.5%) and ytd (-24.2%). Government offices were down m/m (-17.8%) and ytd (-9.0%), but higher y/y (+13.8%). And warehouse starts plummeted m/m (-64.0%); were less shaky y/y (-21.2%); while they soared ytd (+31.1%).
The most obvious patterns in the 12-month moving average are to be found in private office buildings and roads/highways, although the latter has only recently become prevalent.
August’s Employment Situation report from the BLS shows total private-sector average hourly earnings inching up to +2.2% year over year from +2.1% reported in July. The same goes for average weekly earnings, +2.5% versus +2.4%. In construction, average hourly earnings have elevated to +2.8% from +2.6% and average weekly earnings to +2.3% from +1.8%.