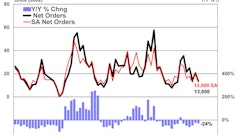
According to CMD, December’s level of U.S. construction starts, excluding residential work, was $22.2 billion, a drop of 6.9% versus November. The pull-back was only slightly more than the usual or long-term December-versus-November percentage change, due to seasonality, of -5%. (To note for January, weather usually has an even greater effect in that month, -8.5%.)
Compared with December of 2014, the latest month’s starts level was -7%; but versus the five-year average for December over the past five years (i.e., 2010 to 2014 inclusive), it was 9.2%.
Full year 2015 starts were 1.9% relative to the same January-to-December period of 2014.
The starts figures throughout this report are not seasonally adjusted (NSA). Nor are they altered for inflation. They are expressed in what are termed ‘current’ as opposed to ‘constant’ dollars.
‘Nonresidential building’ plus ‘engineering/civil’ work accounts for a considerably larger share of total construction than residential activity. The former’s combined proportion of total put-in-place construction in the Census Bureau’s November report was 62%; the latter’s was 38%.
CMD’s construction starts are leading indicators for the Census Bureau’s capital investment or put-in-place series. Also, the reporting period for starts (i.e., December 2015) is one month ahead of the reporting period for the investment series (i.e., November 2015.)
The latest Employment Situation Report from the Bureau of Labor Statistics (BLS) records a 45,000 increase in the total number of construction jobs in December. That was 2015’s second-strongest period for job creation in the sector. Only the prior month, November, was better, at 48,000. Year-over-year employment in construction ended 2015 up 4.2%, leading all major employment subcategories. The total employment increase in America was less than half as fast, 1.9%. Construction’s not-seasonally-adjusted unemployment rate in December was 7.5%. In December 2014, it had been 8.3%; in December 2013, 11.4%; and in December 2012, 13.5%.
Before there can be on-site construction activity, projects must be contemplated and planned by owners and rendered into working drawings by design professionals. On a month-to-month basis, total jobs in architectural and engineering services in December were 0.3%. Their year-over-year change was 2.5%. Earlier in 2015 (i.e., in March), they were a more impressive 3.9%.
All three major type-of-structure categories saw month-to-month starts declines in December. The retreats for commercial (-4%) and heavy engineering/civil (-6.2%) were less severe than for institutional (-22.5%). The normally smaller-dollar-volume category of industrial, however, took a big leap forward (512.9%). Industrial starts can swing wildly from one month to the next, based on whether or not there is a go-ahead for a mega project or two. In December, site work began for Volkswagen’s sport utility manufacturing plant in Chattanooga, Tennessee.
Comparing standalone December 2015 with its counterpart in 2014, the declines for commercial (-8.9%) and engineering (-3.3%) were again smaller than for institutional (-21.6%). Industrial starts (238.3%) in the most recent December were better than in the prior year’s same month.
Full-year 2015 starts, though, were led by the engineering category, 10.9% compared with full-year 2014. The annual industrial starts figure was also positive, 32.8%, while there was a mild decline in commercial, -4.2%, and a more substantial setback for institutional initiations, -7%.
‘Road/highway’ work is by far most important in the engineering category. In December, ‘street starts’ were: -13.8% month-over-month (m/m); -5.8% year over year (y/y); but 9.2% year to date (ytd or full-year 2015 vs. full-year 2014). For all 2015, their slice of engineering was 42%.
Claiming second place among engineering starts, with a 23% or nearly one-quarter share, the ‘water/sewage’ subcategory in December was: -11.6% y/y; but 2.1% m/m; and 10.6% ytd.
The ‘miscellaneous civil’ subcategory, which includes railroads, power plants, pipelines and other energy projects was: 12.7% m/m; 7.7% y/y; and 16.5% ytd.
Within institutional work in full-year 2015, the ‘school/college’ subcategory was dominant with a 60% grasp of the total. Nevertheless, education facility starts in December were negative across the board: -18.7% m/m; -34% y/y; and -4.5% ytd.
Next most significant under the institutional umbrella are ‘hospital/clinic’ starts. They also disappointed in December: -40.3% m/m; -25.9% y/y; and -13.7% ytd.
Sources of strength in the institutional category in 2015 were the ‘police/courthouse/prison’ (-25.9% m/m; -23.2% y/y; but 46.3% ytd) and ‘nursing/assisted living’ (-15.9% m/m; but 1.3% y/y; and 20.7% ytd) subcategories.
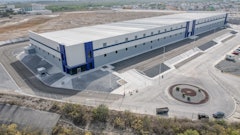
Commercial starts in 2015 were buoyed by the ‘retail’ (-30.6% m/m; -5% y/y; but +7.3% ytd), ‘hotel/motel’ (-38.8% m/m; but 6.9% y/y; and 3.7% ytd) and ‘warehouse’ (-55.2% m/m; but 67.7% y/y; and 42.7% ytd) subcategories. The latter was especially bolstered by several outsized data and call center projects that border on being categorized to the ‘private office building’ category — which otherwise was 89.6% m/m; but -7.8% y/y; and -32.6% ytd.
The ‘Top 10’ projects list on page three holds two contributions from both New York and California. All other states account for a single groundbreaking each. The number one project, by dollar value, is the Garvies Point residential complex ($1 billion) in N.Y. Second in line is the Gaylord Rocky Mountain Hotel and Convention Center ($800 million) in Aurora, Colo.
The 12-month moving average trend-line graphs on page four of this report show the curves for nearly all the non-residential building categories — with retail (i.e., flat) as the only exception — shifting downwards over the last six months to a year. For heavy engineering, the slopes for ‘roads/highways’, ‘water/sewage’ and ‘bridges’ have been most noticeably on an upward incline.
Despite the low economy-wide jobless rate of 5%, compensation levels for all workers, including supervisory personnel, remained restrained in December: 2.5% year over year for average hourly earnings and 2.2% for average weekly earnings. The construction sector turned in a livelier performance: 2.9% for average hourly earnings and 4.2% for average weekly earnings. A few more data points will be needed, however, to establish if that is a definite trend.
The value of construction starts each month is summarized from CMD’s database of all active construction projects in the U.S. Missing project values are estimated with the help of RSMeans’ building cost models.
CMD’s nonresidential construction starts series, because it is comprised of total-value estimates for individual projects, some of which are ultra-large, has a history of being more volatile than many other leading indicators for the economy.
A “start” is determined by taking the announced bid date and adding a short time lag (30 to 60 days). CMD continues to follow the project via its network of researchers. If it is abandoned or re-bid, the start date is updated to reflect the new information.