A 1.7% decline in December public-sector U.S. construction spending overcame 0.5% growth in private residential spending for a 0.2% slide in total value of construction put in place for the month.
Public construction spending declined in nearly every category. The substantial public educational sector saw a 2.2% drop for the month, but total 2016 spending on construction of public educational facilities rose 4.7% above 2015’s level. The largest public-spending segment – highway and street – while slipping 0.6% for the month finished 2016 2.0% higher than spending in 2015.
Public spending on sewage and waste disposal fell 5.6% for the month, and the value of public construction put in place in that category plunged 9.3% for the full year, compared to 2015. The similar-sized transportation sector slipped 0.8% in December, but fell 5.2% for the year.
Private construction spending rose for the third-straight month, with residential edging 0.5% higher as increases in new single- and multifamily construction offset slight decline in home improvement. The value of all private residential construction put in place in 2016 was 5.2% greater than in 2015.
Private nonresidential spending was flat in December, with 1.6% and 0.7% growth, respectively, in the huge power and commercial sectors balancing a 3.5% drop in the value of manufacturing construction. The manufacturing sector’s construction spending in 2016 is 4.3% below its 2015 totals, but private commercial construction leapt 10.4% for the year, while power construction grew 6.1%.
The value of private office construction put in place in December rose 2.0% and health care was up 1.2% to counteract a 4.4% drop in lodging construction. Private office construction finished 2016 a whopping 29.5% above its 2015 pace, and lodging construction spending soared 26.4% above 2015.
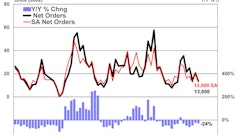
Value of US Construction Put In Place
(millions of dollars)
| Month's spending* | Year-to-date | ||||||
| Type of Construction | December 2016 |
% change vs Nov 2016 | % change vs Dec 2015 | December 2016 |
December 2015 |
% change | |
| Total Construction | 1,181,523 | -0.2 | 4.2 | 1,162,351 | 1,112,433 | 4.5 | |
| Residential | 473,279 | 0.4 | 3.6 | 462,640 | 440,255 | 5.1 | |
| Highway and street | 94,530 | -0.6 | 1.4 | 91,428 | 89,751 | 1.9 | |
| Power | 93,545 | 1.2 | -0.1 | 95,260 | 92,435 | 3.1 | |
| Educational | 90,638 | -2.1 | 5 | 88,690 | 83,517 | 6.2 | |
| Commercial | 78,715 | 0.6 | 12 | 74,242 | 66,924 | 10.9 | |
| Office | 75,796 | 1 | 31 | 68,935 | 55,188 | 24.9 | |
| Manufacturing | 68,745 | -3.3 | -5.9 | 74,829 | 78,178 | -4.3 | |
| Transportation | 42,115 | -1.4 | -6.5 | 42,794 | 45,566 | -6.1 | |
| Health care | 41,899 | 0.6 | 7.1 | 41,415 | 40,734 | 1.7 | |
| Lodging | 27,316 | -4.6 | 19.9 | 27,122 | 21,728 | 24.8 | |
| Amusement and recreation | 22,791 | -0.3 | 13 | 21,794 | 19,878 | 9.6 | |
| Communication | 21,666 | 5.5 | 2.6 | 19,698 | 20,507 | -3.9 | |
| Sewage and waste disposal | 19,321 | -5.7 | -18 | 22,143 | 24,285 | -8.8 | |
| Water supply | 11,640 | -1.8 | -0.3 | 11,875 | 13,107 | -9.4 | |
| Public safety | 8,269 | 2.3 | -2.8 | 8,084 | 8,729 | -7.4 | |
| Conservation and development | 7,836 | -1.9 | 12.8 | 7,667 | 7,985 | -4.0 | |
| Religious | 3,421 | -6.5 | -3.1 | 3,735 | 3,667 | 1.9 | |
| Total Nonresidential | 708,244 | -0.7 | 4.6 | 699,710 | 672,178 | 4.1 | |
* Seasonally adjusted annual rate