The 2017 Paving 50 contractors generated $503,576,781 in paving-only sales. That’s a significant decline from almost $713 million in 2016 (and from $875 million in 2015, and $621 million in 2014), but in each of those years the list contained 75 companies.
Because there are fewer companies in the list, speculation as to the decline (if there really is one, though the trend does seem to indicate it) is difficult. As we pointed out last year, paving-only sales in 2015 list were so high at least partly as a result of the pent-up demand from the Great Recession (work was completed in 2014). Once that demand was met the markets could have settled into a more normal rhythm.
As in the past, paving-only sales continue to dwarf sales of other industry segments, with pavement repair-only sales coming in second at more than $165 million, followed by striping-only sales of more than $139 million and sealcoating-only sales of more than $112 million. That paving volume outpaces all other categories makes complete sense given the size, cost, cost of material and complex nature of many hot mix asphalt paving jobs.
Total Sales for Paving 50
Total sales for all the work the 2017 Paving 50 did was $962,411,076 – the lowest total since we began reporting this information in 2014 ($1,548 billion in 2016; $1.649 billion in 2015; $1.122 billion in 2014). So paving-only sales represent 52% of total list sales, up from 46% in 2016, down from 53% in 2015 and down from 55% in 2014. The remaining 48% of sales come from a broad mix of other pavement maintenance services:
· 48 companies perform sealcoating work
· 40 companies perform striping (though 32 of those companies generate 5% or less of sales from striping)
· 40 companies perform pavement repair work
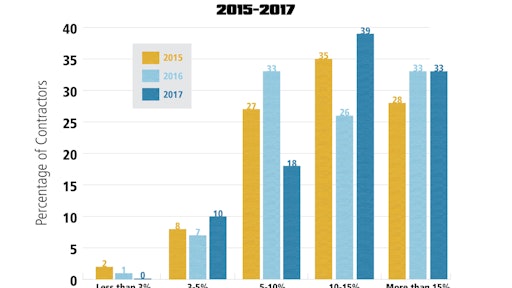
Paving contractors generating less than 5% profit margin (10% of this year’s list) might need to be concerned about their margins – and their survival. And it’s certainly possible many of those lower-margin contractors are high-volume pavers (working primarily on roads and highways as opposed to parking lots?) where they make up in volume what they lack in margin. Hopefully that’s the case because paving contractors working on driveways and parking lots who generate a less-than-5% profit are doing themselves (and the market) a disservice.
Where Pavers Work
There’s no question that the Paving 50 emphasize off-road work, with 12% reporting 100% of sales from parking lots, 16% reporting 90% or more of sales from parking lots, and 62% reporting sales from driveway paving. All of the Paving 50 indicated they generate sales from parking lot work. Still, 56% report sales from work on streets and 22% report they work on highways
The Paving 50’s Customers
· 48 contractors work for commercial/industrial customers (96%)
· 44 contractors work for multi-family residential customers (88%)
· 34 contractors work for municipal clients (68%)
· 27 contractors work for single-family homeowners (54%)