On the heels of consecutive months of strengthening business conditions, the Architecture Billings Index (ABI) has now reached positive territory three months in a row. As a leading economic indicator of construction activity, the ABI reflects the approximate nine- to twelve-month lag time between architecture billings and construction spending.
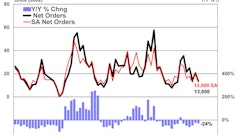
The American Institute of Architects (AIA) reported the January ABI score was 50.9, following a mark of 51.0* in December. This score reflects a slight increase in demand for design services (any score above 50 indicates an increase in billings). The new projects inquiry index was 61.2, down slightly from a reading of 61.5 the previous month.
“Even though we had a similar upturn in design billings in late 2010 and early 2011, this recent showing is encouraging because it is being reflected across most regions of the country and across the major construction sectors,” said AIA Chief Economist Kermit Baker, PhD, Hon. AIA. “But because we still continue to hear about struggling firms and some continued uncertainly in the market, we expect overall economic improvements in the design and construction sector to be modest in the coming months.”
January ABI highlights:
- Regional averages: Midwest (53.7), South (51.6), Northeast (50.7), West (45.6)
- Sector index breakdown: multi-family residential (52.6), commercial / industrial (52.2), institutional (51.1), mixed practice (46.1)
- Project inquiries index: 61.2
Note: regional and sector categories are calculated as a 3-month moving average, whereas the index and inquiries are monthly numbers.
About the ABI
The ABI produced by the AIA Economics & Market Research Group, is a leading economic indicator that provides an approximately nine- to twelve-month glimpse into the future of nonresidential construction spending activity. The diffusion indexes contained in the full report are derived from a monthly “Work-on-the-Boards” survey that is sent to a panel of AIA member-owned firms. Participants are asked whether their billings increased, decreased, or stayed the same in the month that just ended as compared to the prior month, and the results are then compiled into the ABI. These monthly results are also seasonally adjusted to allow for comparison to prior months. The monthly ABI index scores are centered around 50, with scores above 50 indicating an aggregate increase in billings, and scores below 50 indicating a decline. The regional and sector data are formulated using a three-month moving average. More information on the ABI and the analysis of its relationship to construction activity can be found in the White Paper Architecture Billings as a Leading Indicator of Construction: Analysis of the Relationship Between a Billings Index and Construction Spending on the AIA web site.
* Every January the AIA research department updates seasonal factors used to calculate the ABI, resulting in a revision of recent ABI values.