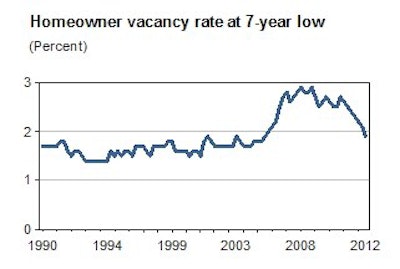
The homeowner vacancy rate (HVR) fell to a seven-year low of 1.9 percent at the end of the third quarter, a sign that the economy has worked off most of the excess construction built up during the housing boom years. This statistic, which measures the proportion of homes vacant and for sale, is one of the more important housing indicators. It is also one of the more overlooked.
The HVR is useful for gauging excess housing supply. A rule of thumb: the further above 1.65 percent, its average value for the 20-year period ending in 2004, the greater the excess. And the further below 1.65 percent, the tighter market conditions. HVR rose starting in early 2005 and peaked at 2.9 percent in 2008. Since late 2010, it has been dropping almost as quickly as it shot up in 2005.
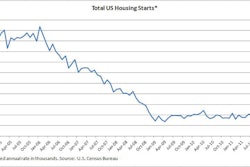
The HVR is telling us that markets are more in balance than they have been in several years, which might partially explain why home prices are rising in so many places. It also might explain why builder confidence is picking up and why builders are ramping up starts. It is one more reason to believe that housing will be one of the economy’s better-performing sectors over the next three years.
Three Census Bureau programs track this statistic. The most closely followed - because it is the most current - is the quarterly estimate from the Housing Vacancies and Homeownership (HVH) report. The American Community Survey (ACS) also publishes an annual estimate. And every 10 years, Census publishes an official estimate off the decennial census count. The good news is that the estimates from all three sources are similar. For example, the Housing Vacancies and Homeownership first-quarter 2010 estimate was 2.6 percent, with a margin of error of plus or minus 0.2 percentage point, meaning that it was not statistically different from the decennial census 2.4 percent computed value.
The reason these estimates are similar might be that a vacant home for sale is easy to identify - most have a for sale sign posted, for example. Another measure of excess, the National Association of Realtors (NAR) monthly housing inventory estimate, is highly correlated with the homeowner inventory vacant and for sale number (which one can derive by multiplying the homeowner vacancy rate by the homeowner inventory) - but it is inexplicably a bit choppier. The NAR’s concept also shows inventories approaching normal levels.