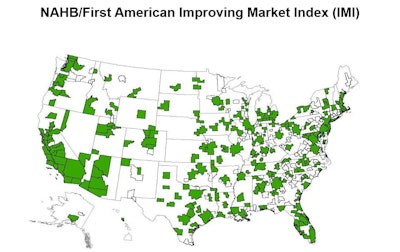
The number of improving U.S. housing markets in August is three times that of August 2012, and nearly 70 percent of all U.S. metros are represented.
A total of 247 metropolitan areas across 49 states and the District of Columbia make up the National Association of Home Builders/First American Improving Markets Index (IMI). Eight metros listed in July did not make the August IMI.
The IMI identifies metropolitan areas that have shown improvement from their respective troughs in housing permits, employment and house prices for at least six consecutive months. Three new markets were added to the list and 11 dropped from it in August.
Newly added metros include:
- Kankakee, Ill.
- Atlantic City, N.J.
- Ocean City, N.J.
“In all, 244 metros that were listed as improving in July retained that status in August, and this is an encouraging sign of the continuing housing recovery,” noted NAHB Chairman Rick Judson, a home builder from Charlotte, N.C. “That said, we know that the pace of improvement is being hampered somewhat by challenges that builders and buyers are experiencing with regard to the availability of credit, materials, lots for development and labor.”
“While the number of improving housing markets this August remains well ahead of the same month last year, the index is affected by seasonal softening in home prices just as we saw happen in 2012. The metros that fell off the list this month originally qualified with very small home price improvements that have since slipped back,” explained NAHB Chief Economist David Crowe. “As house prices return to more normal levels in fully recovered markets, further IMI advancements will be more modest.”
The IMI is designed to track housing markets throughout the country that are showing signs of improving economic health. The index measures three sets of independent monthly data to get a mark on the top Metropolitan Statistical Areas. The three indicators that are analyzed are employment growth from the Bureau of Labor Statistics, house price appreciation from Freddie Mac and single-family housing permit growth from the U.S. Census Bureau. NAHB uses the latest available data from these sources to generate a list of improving markets. A metro area must see improvement in all three measures for at least six consecutive months following those measures’ respective troughs before being included on the improving markets list.
NAHB/First American Improving Markets Index - August 2013