Following a modest two-month recovery in the level of demand for design services, the Architecture Billings Index (ABI) again turned negative in March.
As a leading indicator of construction activity, the ABI reflects the approximate nine- to twelve-month lead time between architecture billings and construction spending. The American Institute of Architects (AIA) reported the March ABI score was 48.8, down sharply from a mark of 50.7 in February. This score reflects a decrease in design services (any score above 50 indicates an increase in billings). The new-projects inquiry index was 57.9, up from the reading of 56.8 the previous month.
With this release, the AIA has added a new indicator measuring the trends in new design contracts at architecture firms that can provide a strong signal of the direction of future architecture billings. The score for design contracts in March was 48.2.
“This protracted softening in demand for design services is a bit of a surprise given the overall strength of the market the last year and a half,” said AIA Chief Economist Kermit Baker. “Hopefully, some of this can be attributed to severe weather conditions over this past winter. We will have a better sense if there is a reason for more serious concern over the next couple of months.”
Key March ABI highlights:
Regional averages: South -- 52.8; West -- 50.7; Northeast -- 46.8; Midwest -- 46.6
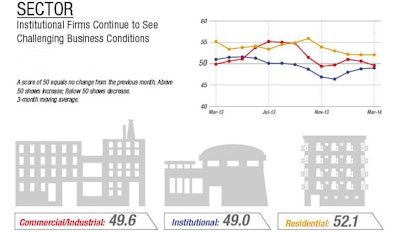
Sector index breakdown: multi-family residential -- 52.1; commercial / industrial -- 49.6; institutional -- 49.0; mixed practice -- 47.6
Project inquiries index: 57.9
Design contracts index: 48.2
Regional and sector ABI categories are calculated as three-month moving averages, whereas the national index, design contracts and inquiries are monthly numbers.