There has been considerable volatility in the starts series over the last couple of months. July versus June displayed a large drop, -19.7 percent, after June compared with May rose by one-third, +33.4 percent.
August’s volume of $32.17 billion was almost an exact match for June’s $32.05 billion. Both months are now virtually tied for this year’s best.
August of 2014 was +24.6 when compared with the same month of 2013. Year-to-date starts in 2014, at $198.4 billion, have been +8.3 percent versus the same first-eight-month-period of last year.
The starts figures are in “current” dollars, meaning they are not adjusted for inflation.
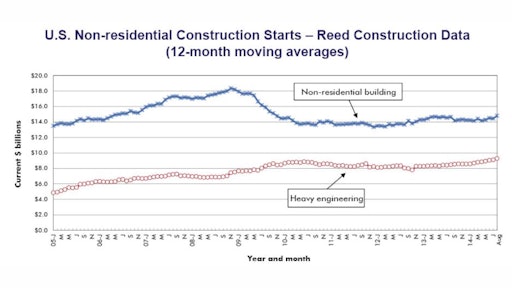
“Nonresidential building” plus “engineering/civil” work accounts for a considerably larger share of total construction than residential activity. The former’s combined proportion of total put-in-place construction in the Census Bureau’s July report was 63 percent versus the latter’s 37 percent.
Reed’s construction starts are leading indicators for the Census Bureau’s capital investment or put-in-place series.
The 4.2 percent annualized increase in “real” (i.e., inflation-adjusted) gross domestic product (GDP) in this year’s second quarter points to a level of business activity that must inevitably give rise to heightened construction activity. Car sales have been speeding along and housing starts have been climbing out of the basement.
NASDAQ has been soaring and both the Dow Jones Industrials index (DJI) and the S&P 500 have set new all-time highs. A pick-up in nonresidential construction usually follows improvement in the broader economy. That day appears to be approaching.
Among the three major construction subcategories, commercial starts in August (+56.9 percent) experienced the largest month-to-month increase. Heavy engineering (+12.7 percent) also saw a nice nudge, while institutional starts (+6.1 percent) recorded a relatively modest gain.
Industrial starts (+961.5 percent) rose almost 1,000 percent, but it was on top of a small base. Nevertheless, attention should be paid to the fact some industry segments within manufacturing are testing capacity constraints, which will necessitate facility expansions. Most notably, car assemblers are working full out, with extra shifts being scheduled and workers putting in lots of overtime.
Compared with the same month of last year, commercial starts (+40.2 percent) were again in the forefront, but heavy engineering (+20.1 percent) and institutional (+16 percent) were in closer competition. Industrial starts (+36.6 percent) were also up to a significant degree.
The standings are quite different in year-to-date starts. Heavy engineering (+12.8 percent) is the leader, followed by institutional (+7.9 percent), while commercial (+0.4 percent) gives an appearance of hesitancy. January-to-August industrial starts are +29.7 percent versus the same front two-thirds of last year.
Within commercial, recent lift has been provided by hotel work (+117 percent month over month; +39 percent year over year; and +0.6 percent year to date), the amusement category (+77.6 percent m/m; +42.1 percent y/y; and +11 percent ytd) and warehouses (+282.4 percent m/m; +308.1 percent y/y; and +68.7 percent ytd). The usual sources of commercial strength, retail (-27.1 percent m/m; -42.1 percent y/y; and -8.5 percent ytd) and private office buildings (-28.1 percent m/m; -27.1 percent y/y; but +9.6 percent ytd) have largely disappointed.
Two subcategories dominate institutional starts. Hospital/clinic worked doubled on a month-to-month basis (+102 percent) in August and climbed respectably year over year (+28.3 percent), but remained below 2013 on a year-to-date basis (-14.4 percent). School/college starts ‒ with more than four times the dollar volume of hospital/clinic starts – displayed the opposite pattern. They were down month to month (-5.5 percent), level year over year (-0.2 percent), but higher year to date (+9.2 percent).
Road and highway work (+2.9 percent m/m; +22.4 percent y/y; and +11.5 percent ytd) has been contributing its fair share in the heavy engineering category , but bridge starts – despite well-publicized concern about the structural safety of existing structures ‒ have been a letdown (-20.2 percent m/m; -36.1 percent y/y; and -0.8 percent ytd). The water and sewage sub-category (+4.3 percent m/m; +2.4 percent y/y; and +11 percent ytd) has been a source of positive news, as has the “miscellaneous civil” designation (+69.5 percent m/m; +76.5 percent y/y; and +33.6 percent ytd), which includes power projects.
The Department of Labor’s August Employment Situation report helps to explain the strength in some of the aforementioned construction categories. While the total number of jobs in the economy is +1.8 percent year over year, payrolls in the motor vehicles and parts sector are +5.3 percent; in transportation and warehousing, they are +3.4 percent; and in leisure and hospitality, +2.4 percent.
Year-over-year employment in architectural and engineering services has risen by an encouraging 4 percent. Along the construction pipeline, the “drawing board” stage is in advance of both starts and the hiring of more on-site workers.
The value of construction starts each month is summarized from Reed’s database of all active construction projects in the U.S. Missing project values are estimated with the help of RSMeans’ building cost models.