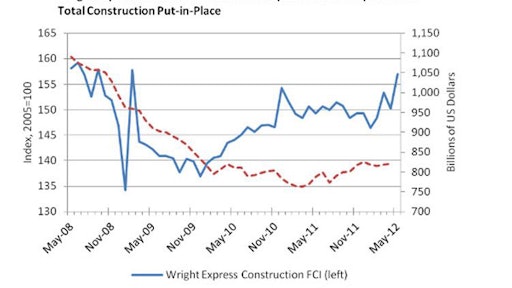
Wright Express Corporation, in collaboration with IHS, said its Construction Fuel Consumption Index (FCI) increased 4.5% in May and is 5.1% higher than May 2011.
The Construction FCI measures national fuel consumption statistics for the construction industry by analyzing transaction data from the Wright Express network of more than 180,000 fuel and vehicle maintenance locations, including over 90% of domestic fuel retailers and 45,000 vehicle maintenance locations. The FCI is intended to provide an up-to-date indication of U.S. construction activity.
Last month’s Wright Express Construction FCI accurately depicted weakness evident in many of the government’s subsequent releases of construction data. Construction spending excluding improvements declined 0.2% in April. Private nonresidential spending decreased by 0.2%, although private residential construction excluding improvements rose 2.1%. Total construction put in place increased by 0.3% in April.
According to IHS analysis, the Construction FCI's up-and-down movement in recent months suggests that the industry’s recovery remains fragile. After three years of depressed construction,new housing inventory is beginning to tighten. New home sales rose 3.3% in April, and estimates for the previous three months were revised upward. The new home sales market is unquestionably improving, although activity is still less than half of normal. Inventory continues to shrink, and builders are expected to replenish stocks by ramping up starts once demand rebounds.
Getting rid of excess housing could, nevertheless, drag on. The homeowner vacancy rate measuring the proportion of homes that are vacant and for sale was 2.3% at the end of 2011, suggesting a glut of about half a million houses. Eliminating the housing surplus could take less than two years at the current pace, but will probably take longer because it is concentrated in a few high-unemployment states.