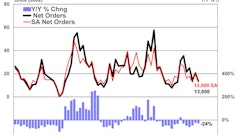
Residential building in December dropped 6 percent to $205.3 billion (annual rate), with both sides of the housing market easing back. Single-family housing slipped 3 percent, according to McGraw Hill Construction, as recent months have shown more of an up-and-down pattern after the consistently steady gains witnessed earlier in the year. But when viewed quarterly, single-family housing registered consistent growth during 2013, with the fourth quarter 8 percent higher than the first.
Total Construction Starts in December Improve 5% on Non-Building Strength
Multifamily housing in December retreated 13 percent after a November increase of the same magnitude. December’s largest multifamily projects were smaller in scale than what had been reported in the previous month, but still included such substantial entries as a $159 million apartment building in Sunny Isles Beach, FL, a $128 million condominium tower in Honolulu, HI, and a $127 million apartment building in Brooklyn, NY.
The 2013 amount for residential building was $205.5 billion, up 24 percent, and close to the 31 percent gain reported for 2012. Single-family housing in dollar terms climbed 26 percent, similar to the prior year’s 29 percent rise. The regional pattern for single-family housing in 2013 showed increases for all five major regions:
- South Atlantic: +33 percent
- Midwest: +27 percent
- West: +26 percent
- Northeast: +26 percent
- South Central: +18 percent
Multifamily housing in 2013 advanced 16 percent, showing additional growth on top of the increases in 2010 (up 23 percent), 2011 (up 33 percent), and 2012 (up 37 percent).
By major region, multifamily housing revealed this performance in 2013:
- Midwest: +26 percent
- Northeast: +24 percent
- South Atlantic: +21 percent
- West: +13 percent
- South Central: -6 percent
The top ten metropolitan areas in terms of the 2013 dollar amount of multifamily starts, with the percent change from 2012, were:
- New York, NY: +23 percent
- Boston, MA: +74 percent
- Washington, DC: unchanged
- Miami, FL: +12 percent
- Los Angeles, CA: -24 percent
- Dallas-Ft. Worth, TX: -6 percent
- Chicago, IL: +52 percent
- Seattle, WA: unchanged
- San Francisco, CA: +12 percent
- Denver, CO: +17 percent


