Estimated January not seasonally adjusted construction unemployment rates fell nationally and in 48 states on a year-over-year basis, according to an Associated Builders and Contractors (ABC) analysis of U.S. Bureau of Labor Statistics data.
As the January 2019 national NSA construction unemployment rate fell 0.9% from a year ago to 6.4%, the construction industry employed 343,000 more workers nationally compared to January 2018, according to BLS numbers.
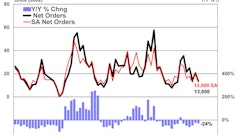
 National not seasonally adjusted construction unemployment rates typically see an increase between December and January.Associated Builders and Contractors
“Despite the government shutdown, the January construction employment numbers continued to be healthy, reflecting the strength of construction throughout the country,” said Bernard M. Markstein, Ph.D., president and chief economist of Markstein Advisors, who conducted the analysis for ABC. “Unemployment rates in January were lower compared to a year ago in 48 states and higher in two — Hawaii and Colorado. The country and 28 of the states posted their lowest January construction unemployment rates on record.”
Because these industry-specific rates are not seasonally adjusted, national and state-level unemployment rates are best evaluated on a year-over-year basis. The monthly movement of the rates still provides some information, although extra care must be used in drawing conclusions from these variations.
The national NSA construction unemployment rate rose 1.3% from December to January — a monthly increase for this period that has been the pattern since the report first began in 2000. All the states posted higher estimated construction unemployment rates this year from December.
[Note: The BLS released benchmark revisions of state data, which affected the estimated construction unemployment rates for the states for 2017 and 2018. See the last section of this article for more information and a link to tables showing and comparing the changes.]
The top five states
The states with the lowest estimated NSA construction unemployment rates in order from lowest to highest were:
- South Dakota, 3.5%
- Utah, 3.8%
- Florida and Oregon (tied), 4.1%
- Maryland, 4.4%
Four of the top states were in the top five in December — Florida, Maryland, South Dakota and Utah. South Dakota had the lowest construction unemployment rate in January, the same as in December (tied with Florida) based on revised data (originally reported as 13th lowest). It was the state’s lowest estimated January rate on record.
Utah had the second lowest rate in January, up from fifth lowest in December based on revised data (originally reported as second lowest). It was the state’s lowest estimated January rate since 2015, when it was 2.6%.
Florida and Oregon tied for the third lowest rate in January. For Florida, this was down from the lowest rate in December (tied with South Dakota) based on revised data (originally reported as ninth lowest). It was the state’s second lowest January rate on record since reaching 4% in 2006. For Oregon, this was up from ninth lowest and was the state’s lowest January construction unemployment rate on record.
Maryland had the fifth lowest rate in January. That was down from third lowest in December based on revised data (originally reported as 18th lowest). It was also the state’s second lowest estimated January rate on record since reaching 4.1% in 2007.
Nevada, which had the fourth lowest rate in December based on revised data (originally reported as third lowest, tied with Georgia), dropped to eighth lowest in January with a 4.7% rate (tied with South Carolina and Texas). Nonetheless, it was the state’s lowest January rate on record.
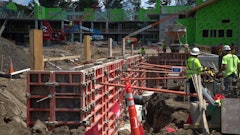
 January construction unemployment rates were lower copmared to year ago levels in 48 states - all except Hawaii and Colorado.Associated Builders and Contractors
The bottom five states
The states with the highest estimated NSA construction unemployment rates in order from lowest to highest were:
- Illinois and Rhode Island (tied), 11.5%
- Iowa, 12.9%
- Montana, 13.7%
- Alaska, 15.5%
All of these states except for Rhode Island were also in the bottom five in December. For the fifth month in a row, Alaska had the highest estimated construction unemployment rate. This was the state’s lowest estimated January rate since the 14.4% posted in 2015.
Montana had the second highest rate in January, a slip in ranking from December’s third highest (tied with Illinois) based on revised data (originally reported as second highest). This was the state’s lowest January rate since state unemployment registered 13% in 2008.
Iowa had the third highest rate in January compared to second highest in December based on revised data (originally reported as seventh highest). This was the state’s lowest estimated January rate since it reached 10.1% in 2015.
Illinois and Rhode Island tied for the fourth highest rate in January. For Illinois, this was a slight improvement in ranking from third highest in December (tied with Montana) based on revised data (originally reported as fifth highest). This was the state’s lowest January construction unemployment rate on record. For Rhode Island, this compared to 16th highest in December and was the state’s lowest estimated January rate since it hit 11.3% in 2007.
For Wyoming, which had the fifth highest rate in December based on revised data (previously reported as 19th highest), improved in ranking to ninth highest with a 10.1% rate (tied with Kentucky). This was the state’s lowest January rate since it dipped to 9.5% in 2015.
Note on data revision
On March 11, BLS released its benchmark revision of state employment data covering the period from April 2017 through December 2018. The models used to estimate state construction unemployment rates were updated incorporating the revised data. The revised data and the updated models used in the January 2019 estimates resulted in some changes to the estimated state unemployment rates from January 2017 through December 2018.
The average change among the states (ignoring sign) was 1%, ranging from an average change of 4% (Missouri) to 0.1% (Michigan). After Missouri, the next largest average change was Wisconsin (2.5%). Five states had average change of 2% or higher, 13 states had average change ranging from 1% to 1.7%, and the rest (32 states) had an average change below 1%.
To better understand the basis for calculating unemployment rates and what they measure, see the article Background on State Construction Unemployment Rates.