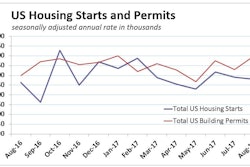
August’s volume of construction starts, excluding residential activity, was $28.7 billion, according to ConstructConnect. The month-to-month performance was -9.8%, a somewhat steeper decline than the usual July-to-August change, due to seasonality, of -3.5%.
August of this year versus the same month of last year recorded a large drop, -18.5%. But standalone August of this year versus August’s average level over the previous five years (2012-2016 inclusive) was a less intimidating -3.5%. Year-to-date starts through the first eight months of 2017 are still slightly ahead of where they were for the same January-to-August period of 2016, +1.6%.
The starts figures throughout this report are not seasonally adjusted (NSA). Nor are they altered for inflation. They are expressed in what are termed "current" as opposed to "constant" dollars.
Nonresidential building plus engineering/civil work accounts for a larger share of total construction than residential activity. The former’s combined proportion of total put-in-place construction in the Census Bureau’s July report was 56%; the latter’s was 44%.
ConstructConnect’s construction starts are leading indicators for the Census Bureau’s capital investment or put-in-place series. Also, the reporting period for starts (i.e., August 2017) is one month ahead of the reporting period for the investment series (i.e., July 2017.) According to the latest Employment Situation report from the Bureau of Labor Statistics (BLS), the total number of jobs in the U.S. construction sector rose by +28,000 in August. The monthly average increase so far in 2017 has been +17,000, nearly double 2016’s +9,000 for the same time frame.
The NSA unemployment rate in construction has dropped to 4.7%. A year ago, it was 5.1%. Rebuilding efforts in the Houston area and throughout Florida, after the painfully severe touch-downs of Hurricanes Harvey and Irma, are sure to increase the demand for construction workers.
The year-over-year climb in the number of construction jobs in August, at +3.2%, was already more than double the rate of increase for all employment in the economy, +1.4%. Payroll improvements in two other sectors also suggest further pickups in on-site building work. Hiring by ‘architectural and engineering services’ firms in August was a robust +3.7% year over year. Additionally, employment with ‘machinery and equipment rental firms’ moved from being flat year over year at the beginning of 2017 to an advance of +7.1% in the most recent month.
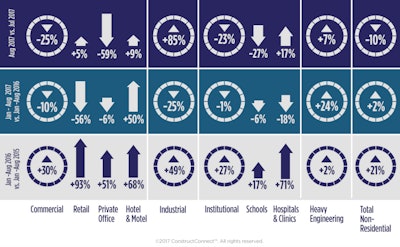
August’s month-to-month (m/m) starts decline (-9.8%) was caused by a drop of one-quarter (-25.0%) in commercial work and an almost equally harsh contraction in the institutional (-22.7%) category. Engineering starts (+6.8%) managed a moderate pickup, while industrial (+85.1%) nearly doubled. The gain in manufacturing, however, was on top of a relatively low base.
As for August 2017’s large shortfall (-18.5%) compared with August 2016 (i.e., year over year or y/y), commercial (-48.9%), industrial (-42.1%) and institutional (-15.7%) were all to blame. Only heavy engineering/civil work (+14.0%) made forward progress.
The year-to-date (ytd) total starts performance of +1.6% received no help from either commercial (-9.8%) or industrial (-25.2%). But institutional (-1.2%) stayed essentially neutral and engineering (+24.1%) came through with a sizable bump.
Within the engineering category, ‘road/highway’ (with a 40% share so in 2017) is the largest subsegment. In August, street starts were -17.5% m/m and -7.5% y/y, but +14.5% ytd. Water/sewage starts account for the second biggest slice (23%) of civil and, most recently, they were +15.7% m/m and +14.9% ytd, but -6.2% y/y. Bridges is another important category within engineering and its August numbers were: -1.2% m/m; but +81.9% y/y; and +45.4% ytd.
The institutional category of starts is dominated by schools/colleges (with a share of 56%). In the latest month, the percentage changes of educational starts were all negative: -27.4% m/m; -20.3% y/y; and -5.9% ytd. Hospital/clinic work accounts for the next largest chunk of institutional (14%) and in August it had a nice uptick m/m (+17.3%) but declines both y/y (-30.5%) and ytd (-17.9%). ‘Fire/police/courthouse/prison work, however, was a source of strength. It managed nothing but increases: +21.8% m/m; +3.9% y/y; and +43.0% ytd. Courthouses (+127.5 ytd) and prisons (+39.8%) did the heavy lifting in that subcategory.
At the top of the food chain in the commercial category to date in 2017 has been hotel/motel work (with a 22% share). The latest figures for accommodation starts have been: +8.8% m/m; 0.0% (i.e., no change) y/y; but an impressive +50.1% ytd. Not far behind hotels/motels for market share of commercial is private office buildings (20%), but that subcategory behaved poorly in August: -59.1% m/m; -74.1% y/y; and -6.0% ytd. Retail/shopping, which usually contributes more to the commercial total than its current 14% share, was ahead m/m (+4.5%), but distressingly down both y/y (-67.2%) and ytd (-56.3%). Warehouse work, which includes distribution centers for Internet retail sales, was -35.8% m/m; and -42.8% y/y; but +23.6% ytd.
Finally, sports stadium starts also warrant mentioning for nearly doubling ytd (+90.3%).
Nonresidential building is currently heading down more aggressively than heavy engineering is shifting up. Retail and private office buildings have taken notably wrong turns. Schools/colleges and hospitals/clinics have also been losing traction. Moving in the opposite direction, have been roads/highways, miscellaneous civil (e.g., pipelines) and bridges.
August’s Employment Situation report from the BLS records gains of +2.5% y/y and +2.8% y/y in average hourly and average weekly earnings for all workers (including supervisors) in the U.S. economy. Construction personnel fared better at +2.7% and +3.2%. Table B-8 of the report, for production workers only (i.e., omitting bosses), sets out earnings advances of +2.3% hourly and +2.6% weekly economy-wide. Those employed specifically in construction, however, received half a percentage point more hourly, +2.8%, and a full percentage point more weekly, +3.6%.
The value of construction starts each month is summarized from ConstructConnect’s database of all active construction projects in the U.S. Missing project values are estimated with the help of RSMeans’ building cost models. ConstructConnect’s nonresidential construction starts series, because it is comprised of total-value estimates for individual projects, some of which are ultra-large, has a history of being more volatile than many other leading indicators for the economy.