Compared with the earlier April version of ConstuctConnect’s put-in-place (PIP) investment outlook, grand total construction spending has been modified as follows:
- For 2016, from +9% down to +5.9%
- For 2017, from +8.5% down to +6.9%
- For 2018, from +7.7% to +7.8%
For residential work, 2016 has been adjusted from +11.8% down to +7.6%; 2017, from +10.5% down to +8.4%; and 2018, from +9.5% up to +9.8%.
And for nonresidential, 2016 has gone from +7.2% down to +4.8%; 2017, from +7.2% down to +6%; and 2018, from +6.5% to +6.4%.
The adjustments that have been made in the projections and forecasts largely arise from the shifts occurring in the marketplace.
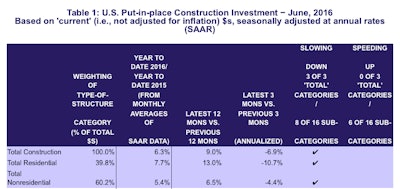
All three major type-of-structure categories — grand total, total residential and total nonresidential — have been slowing down. The same is true for eight of the 16 subcategories.
On the other hand, six of the 16 subcategories have been speeding up.
Taking into account the weightings of each type-of-structure in the grand total, the most significant diminishing performances have been occurring in retail, educational and highway/street work.
The notable accelerations in U.S. construction spending have been in lodging and power.
America’s put-in-place investment figures have been taking some rude hits so far in 2016. That’s not so unusual given that the economy as a whole has not been as buoyant as hoped for when this year’s shiny new calendar was opened on January 1.
Uncertainty about the interest rate environment, energy markets (with oil’s price plunge), the U.K.’s Brexit vote and the stunningly raucous and confusing Presidential election campaign have all sent decision-makers into quandaries concerning their capital spending plans.
But there are numerous indicators pointing to ongoing and potential additional strength for the construction sector.
For starters, the total number of jobs in construction in the U.S. is up almost twice as fast (+3.3% year over year) as for the overall labor market (+1.7%).
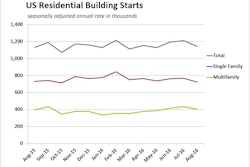
New single-family home sales in July climbed back above 600,000 units to their best level in almost nine years, dating back to October 2007. Residential groundbreakings, which have been becalmed for a year, may be about to catch wind again.
The construction sector’s official unemployment rate, as calculated by the Bureau of Labor Statistics (BLS), is an extraordinarily tight 4.5%. The jobless rate throughout the U.S. economy is higher at 4.9%. Construction’s out-of-work contingent is almost always greater, and often by a vast degree, than in the labor force altogether.
While weekly and hourly earnings for all workers in America were +2.6% year over year in July, they were considerably better, at +3.5% and +4.6% respectively, for non-supervisory wage-earners in construction.
Also, whereas the increase in the total number of jobs in America in the latest month was +1.7%, in that portion of the retail sector most closely aligned with construction — building materials and supplies dealers — the increase in employment was a bullish +4.1%.
There are subsector employment increases that are auspicious for the building of specific physical facilities. Year-over-year employment is currently +3.7% in hospitals; +2.6% in assisted living facilities for the elderly; +2.7% in elementary and secondary schools; +2.4% in colleges and universities; and +2.7% in food services and drinking places.
Four of the five foregoing employment subcategories bear close ties to what is termed institutional construction. The latter, however, — restaurants and bars — is a portion of retail that becomes bundled within commercial construction when new space is initiated.
The challenge for many aspects of commercial/retail construction becomes apparent when one discovers that hiring to sell goods and services over the Internet — an occupation requiring little more than a phone and/or a laptop/desktop computer — is +8.1% year over year.
Thankfully, that’s not the whole story. On the plus side, there is often necessary and related warehouse space to be leased and/or built.
Still, announcements about store closings continue to grab the headlines. Macy’s has been the latest to shutter outlets.
Finally, the lackluster record of investment spending by manufacturers, this year and next, is consistent with staffing in that sector, -0.3% year over year at this time.


![[VIDEO] Senate Weighing 2017 Budget Proposal to Slash $2.2 billion in Highway Funding](https://img.forconstructionpros.com/files/base/acbm/fcp/image/2016/09/default.57d832d076532.png?auto=format%2Ccompress&fit=crop&h=167&q=70&w=250)


