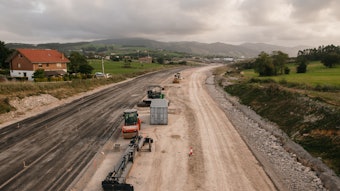
America’s 4 million miles of roads typically see more than 3.1 trillion miles driven annually. That changed abruptly last year when the pandemic forced many states to enact lengthy stay-at-home orders that all but eliminated nonessential travel on roadways.
The U.S. Chamber of Commerce Foundation and Pittsburgh-based tech startup RoadBotics have released a new study, which used artificial intelligence (AI) to assess roadway conditions in 20 of the nation’s major metropolitan areas. As millions of Americans are preparing to return to offices and downtown business districts since the COVID-19 pandemic began, the study ranked the cities where commuters may encounter fewer problems and where headaches may be the worst.
“Stronger roadway systems get people to jobs, connect businesses to markets and serve major economic arteries,” said Michael Carney, senior vice president of emerging issues at the U.S. Chamber of Commerce Foundation. “This innovative look at America’s roadways highlights the urgent need to improve infrastructure in some of the nation’s most dynamic metropolitan areas, and why keeping our roadways in a state of good repair is critical as the economy picks up steam.”
Who Faired the Worst?
U.S. infrastructure is crumbling. Reliable roadways connect supply chains that keep essential goods and services moving and when our roads are not adequately maintained for the needs of our communities, our economy suffers.
Philadelphia’s roadways ranked best for road infrastructure in a study of 20 major metropolitan areas. The study’s results come at a time when talks about the urgent need for physical infrastructure improvements continue in Washington, D.C., and as America’s major metropolitan areas prepare to welcome back millions of commuters who will return to offices and other brick-and-mortar workplaces as America continues its rebound from COVID-19.
Other cities that were studied include some of the country’s most populous and historically traffic-plagued cities. Washington and Los Angeles ranked 10th and 17th respectively, sprawling Houston, TX ranked 13th and Phoenix, AZ tied with Detroit, MI for the worst of the areas studied at 19th. The detailed rankings, outlined here, shine a light on the connection between infrastructure investments and economic health —and warn of the long-term impacts that poorly maintained roads and long commutes have on the country’s business community, already hard hit by pandemic losses and worker shortages.
Data Optimizes Budgets
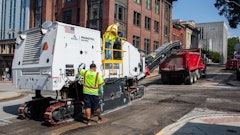
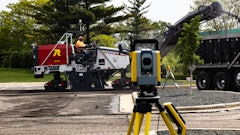
The challenge with monitoring the condition of infrastructure is twofold. Infrastructure is massive in size and scope and can take hours to days for people to physically observe and assess. Companies are emerging that help with roadway data collection to optimize agency budgets. Using technology to asses the condition of our roadways is a relatively new concept. In the past, most asset owners have relied on visual verification of their roadways in order to track repair needs. This is not only a dangerous task, it’s also time consuming and inefficient.
According to the report, using a technology like artificial intelligence to assess roadway conditions is far less expensive than traditional assessment methods. For example, results showed that it took a Geographic Information Systems (GIS) analyst and road maintenance worker about 600 hours (25 days), at a combined hourly rate of $50 and a total cost of $30,000, to conduct a manual assessment of a 150-centerline mile network.
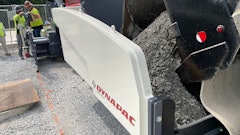
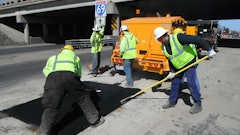
Similar efforts using AI cost half that with the same turnaround time. Instead of agencies manually assessing roadway and pothole damage, roadways can now be visually verified and tracked for repair through AI. This practice not only accelerates the pavement assessment process, but it also provides actionable data that can be used to provide actual results. These modern tools facilitate faster repairs at a lower cost to taxpayers.
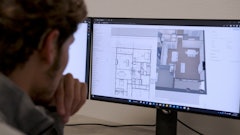
The Foundation partnered with RoadBotics for this particular study. The RoadBotics platform collects data by mounting a smartphone camera running the RoadBotics app into the windshield of a vehicle. The vehicle drives the road network, allowing the app to collect videos of the pavement. The platform blurs people and cars in the imagery for privacy purposes and then processes the remaining data to identify surface distresses like potholes, cracks, and raveling (a type of pavement distress). The RoadBotics platform assigns a rating to that 10-foot section of pavement and then repeats this analysis for the next section until it has generated a highdefinition map of the entire road system.
With all this data at their fingertips, asset owners are better able to present the condition of their roadways to those that make the financial decisions about road funding. This is a huge opportunity for cities with limited resources. Such data is enabling transportation analysts to better understand human factors and proactively show driving environments with poor or degrading safety performance. This data can then be used to activate business districts.
You can view the full report here.