Last year (TC 2024), ahead of the data from the Top Contractor survey coming in, I was predicting a moderate amount of paving specific growth. I was surprised when the data showed just the opposite, and the sector contracted by $68.3 million, or, to put it another way, it shrank about 7.5% from the TC 2023 figure. Unfortunately, this trend continues for this year.
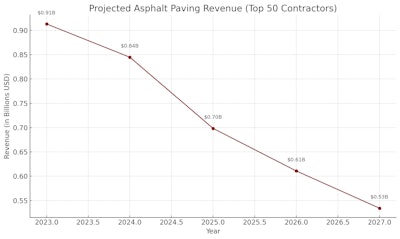
Based on the compound annual decline rate of approximately 12.56%, projections for the Top 50 Paving Contractors' asphalt paving revenue suggest continued contraction. From a peak of $913 million in 2023, the segment fell to $698 million in 2025. If the current rate continues, and this is obvious a really BIG "if" then revenues are projected to drop to approximately $611 million in 2026 and $534 million in 2027.
This trend could reflect factors like decreased infrastructure investment, shifting market demand, or intensified competition. If unaddressed, this decline may have broader implications for the industry. For me, and for Top Contractor, I'm not going to be making any predictions of growth in this category anytime soon. I'm hoping that next year, we will be here, and have a real data point to add that shows it leveling off, at the very least.
Compared to the other individual industry categories in the Top Contractor survey, paving-only sales was still by far the highest earning, followed by pavement repair services at $557,230,541 ($285,633,742 in 2024) and sealcoating work at $165,760,074 ($152,812,613 in 2024) and then by striping sales at $134,120,870 ($89,944,735 in 2024).
Some notable trends:
- Average Gross Sales: ~$30.9 million
- Average Subcontracting Revenue Share: ~22%
- Self-Performance: ~95% of companies self-perform more than 50% of their work
- The paving market is dominated by mature firms with high self-performance rates.
- A significant portion operates at strong profit margins (16–20% or higher).
- Most firms manage high job volumes and invest heavily in fleets, indicating a capital-intensive but profitable segment.
Total Sales for the Paving Top 50
The Top 50 Paving contractors reported $1.906 billion in total sales, a huge increase from 2024’s massive $1.614 billion. A gain of approximately $202 million, a shockingly high growth rate year over year of more than 18%, but that big growth belies some steady declines, according to our data for the paving sector.
Going back to TC 2023, just two years ago, the paving only sales came to a total of $913 million, then in TC 2024 it fell to $845 million, and this year it came in as $698 million. That's three consecutive years of declining paving-only sales. That's a decline of ~17% year over year, and an average loss over three years of more than 8%.
That loss of paving-only sales, is very close to the percent growth of total revenue. This might indicate a shift in revenue stream away from paving to other services that were more in-demand.
This year's $1.906 billion is a large step up from the $1.614 billion from 2024 and if we skip 2023 and go back another year, it shows an overall increase from the 2022 total of $1.331 billion(based on a Top 75), and now TC 2025 takes the crown from what was a previous high of 2023 in $1.723 billion. These figures show that the industry is still growing in terms of gross revenue for the Top 50 Paving Contractors at an average rate of 12.96%, even if the paving only category continues its downward trend. If we look at these totals, year-by-year, for the past seven, this is what we see:
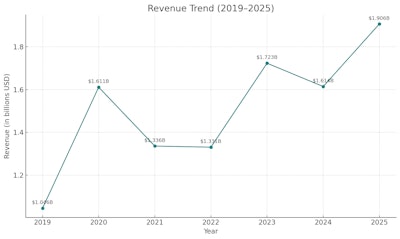
The Cycle Continues
While this doesn’t determine the cause, our survey results suggest a cyclical pattern of growth. There are periods of significant increases followed by one or two years of relatively lower but steady markets, followed by another substantial surge. What could be the reason behind this pattern? In the absence of comprehensive economic statistics, it could indicate that customer paving needs follow a cycle that mirrors the typical lifespan of asphalt pavement, in conjunction with general new construction and community development.
We first hypothesized this cycle last year, and so we included a new question this year concerning how much paving was considered a "new" pavement, and how much was a replacement surface. From the Top 50 Paving Contractors, 80% of their completed work was done on existing pavements, and only 20% was conducted as wholly new surfaces.
While this data is very interesting, it will take a few years for a larger contextual picture to take shape. As profit margins shift, how will this balance move with it? And will this shed light on the theoretical pavement cycle? Time will tell.
Profit Margins
As noted last year, we continue to shift our profit margin ranges in an effort to normalize the distributions, and get a better sense of what this data can really tell us. A quick recap of last year, TC 2024:
- Only 30% (15) of contractors ranked in the highest profit margin range of more than 20%
- 22% (11) ranked in the 16-20% range
- 30% (15) contractors in the 10-15% range
- 16% (8) contractors in the 6-9% range
- Only 2% (1) contractor at 5% or less
If you look at the graph in this section, you'll see the slight 1% shift we've made for TC 2025, and how it is impacted the data this year:
- 40% (20) of contractors now rank in top profit margin range of more than 20%, an increase of 10% over last year, indicating possibly that material prices stabilized from their exorbitant costs the year before, but contractors were able to maintain their pricing levels.
- 14% (7) of contractors ranked in the 16-20% range
- 18% (9) of contractors fell into the mid range of 10-15% profits margins
- 26% (13) shifted into the lower range of 6-10%
- 2% (1) remained as the only contractor with a 5% or less range
This tells us that, according to this distribution, the middle of the profit margin pack shifted away to either higher or lower ranges. One possible explanation could be that smaller contractors were taking on less work for higher profits, and/or some larger contractors were doing an increased amount of work for slightly less of a margin. Either way, companies moved out of the mid pack, causing the top earners to earn more.
Type of Jobs
Same as the year before, every contractor in the Paving 50 did at least some parking lot work, but the average of their work fell from 72% (2024) to 61% (2025), there was one outlier that only derived 5% of their work from parking lots
That same outlier did the fully remainder of their work (95%) in paving roads, combining their residential streets and highway work, which was the highest at 80%, and threw off that average since only 28% of contractors did any highway work at all. Though, that was an increase from the 16% in 2024, this could be the result of more federal funding trickling down into the market.
29 contractors did some driveway construction at an average of 20% of their total work composition.
Customer Mix
While every contractor did work in the commercial/industrial space, the lowest being from one contractor who only did 8% of their work in commercial spaces, but the overall average was 54% the exact same percentage as TC 2024. That sector is holding steady.
- 41 contractors completed work for cities or municipalities at an average of 19% of their work composition, a 3% increase.
- 46 did work for multi-family residences at an average of 21% of their work composition, a drop of 8%.
- 27 contractors completed work for single-family residence at an average of 16% of work composition, a 2% increase.
- 8 Contractors did "other" uncategorized work, at a rate of 18% of their mix.
- 48 of the Top 50 Paving contractors self-performed at least 50% of their work, but interesting 46 of the Top 50 did work as a subcontractor for someone else, and generated almost 25% of their gross revenue from acting as a sub.
Number of Customers and Projects
- 22% (11) of contractors worked for more than 400 customers and 46% (23) completed more than 400 projects.
- 4% (2) worked for 301-400 customers and 18% (9) completed between 301-400 jobs.
- 20% (10) had between 201-300 customers and 10% (5) did that many projects.
- 20% (10) worked for 151-200 customers and 6% (3) did the same number of jobs.
- 14% (7) had between 101-150 customers, and 16% (8) did the same number of jobs.
- 20% (10) of contractors worked for less than 100 customers, but only 4% (2) did fewer than 100 projects.
Fleet Replacement
- Fleet Value Over $2M: ~54%
- Fleet Value $1M–$2M: ~25%
- Smaller fleets (<$1M): ~21%
With the rising costs of equipment, and the implementation of import tarrifs this year, expect this range to increase and change for next year, 2026. But, for now, there were 34 contractors reporting it requires more than $2 million to replace their current fleet of machines. Ten companies reported it would require between $1 - $2 million, 2 between $500,000 - $1 million, and 2 apiece for the ranges between $250K - $500K and less than $250K.


