The number are hard to argue with, and it makes it even more difficult knowing that sealcoating is such a cash-cow product for many contractors. Despite a good year for both individual categorical revenue growth and profit margin increases, the long-term forecast is still showing a downward trend over the last decade.
Is there a cause for concern? In short, I think so. Is it an emergency? Probably not. But let's take a closer look at the numbers.
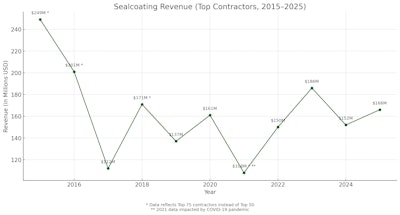
These are the plots for the Top Sealcoating Contractors dating back to 2015 to present. Based on the data provided for top contractor revenue in sealcoating from 2015 to 2025, the Compound Annual Growth Rate (CAGR) over this 11-year period is approximately -3.97%. This indicates a steady long-term decline in annual revenue for this service segment.
Year over year, the sector actually grew by $14 million in TC 2025 at $166 million, going from TC 2024's $152 million. Additionally, it's still a dip in revenue from TC 2023 by $20 million (-10.75%) which was $186.1 million and the highest since 2016.
The sealcoating sector has seen volatility: large drops (e.g., 2017, 2021) followed by partial recoveries.
- Despite recent growth from 2021–2025, the overall trend from 2015 shows contraction, especially when comparing the peak of $249M in 2015 to $166M in 2025.
- Structural industry factors—such as changes in pavement management strategies, increased durability of materials, or budget shifts to other service areas—may be contributing to this slow erosion in demand or revenue share.
Assuming this average annual rate of decline continues, and that there are not major or unforeseen disruptions, the next three years might look like this for the Sealcoating Top 50 Contractors:
- 2026: ≈ $159.4 million
- 2027: ≈ $153.1 million
- 2028: ≈ $147.0 million
Total Sales for the Sealcoating Top 50
In 2025, the total sales revenue for the Top 50 Sealcoating Contractors reached $1.811 billion, a notable rebound from $1.59 billion in 2024. Despite this increase in overall revenue, the actual income derived from sealcoating services tells a different story—just $166 million in 2025.
That figure represents only 9.2% of the total sales, a further decline from 11% in 2024 and 22% in 2023. This indicates a clear and consistent trend: even companies recognized for their sealcoating work i about the s increasingly relying on other service lines to drive their revenue. The sealcoating segment continues to shrink as a share of their business portfolios, possibly due to shifting demand, longer pavement lifespans, or more lucrative alternatives like paving or pavement repair.
This shift suggests that sealcoating is transitioning from a core revenue source to a more supplementary service. While two outliers still generate more than 90% of their income from sealcoating, they are exceptions in an industry where diversification is a key to stability and growth over time.
Most of the Top 50 contractors seem to be treating sealcoating as just one part of a broader service offering. This dilution of sealcoating's share may also reflect broader market forces—such as budget constraints in property management or evolving infrastructure priorities—that are pushing contractors to focus on higher-margin or more in-demand services.
As this pattern continues, it may further marginalize sealcoating as a primary revenue stream, signaling a long-term structural shift within the pavement maintenance industry. The days of sealcoaters trucking around and making a living off that alone may be coming to a definitive end.
Profit Margins
Despite the decline in sealcoating’s share of total revenue, the sector maintains relatively strong profitability. According to 2025 data:
- 46% (23) of the Top 50 Sealcoating contractors reported profit margins exceeding 20%.
- 14% (7) in the 10–15% range.
- 28% (14) earning 6–10%.
- 2% (1) fell between the 3-5% range.
This indicates that while sealcoating may represent a shrinking slice of their revenue mix, it is still often a high-margin service. The high profitability, particularly among contractors with diversified service offerings, may explain why companies continue to keep sealcoating in their portfolios—even as its contribution to total revenue declines.
It remains a strategically valuable line of work, especially when bundled with other services that allow for operational efficiencies and upselling opportunities. But I think that something is clearly happening between the lines. The middle of the pack is slowly eroding. As the years have progressed, more and more of the Top 50 Sealcoating Contractors have either found ways to maximize the efficiency and profitability, pushing them to the top end, or the service has fallen down as merely a supplementary service or an add-on. But there's a third possibility too.
Our survey question about self-performance versus subcontracting doesn't specify based on category. It's a general revenue question. It could be possible that the drop in revenue, but steady hold in profitability is due to larger dominant contractors subbing out their sealcoating to smaller companies. I'm not basing that on anything other than a supposition, so don't quote me on it, but it is a possibility.
When comparing the 2024 and 2025 profit margin data for the Top 50 Sealcoating Contractors, a clear upward shift in profitability emerges. In 2024, 34% of contractors reported profit margins greater than 20%, but in 2025, that number jumped to 46%, indicating a substantial increase in top-tier profitability. Additionally, the share of contractors in the 16–20% range dropped from 22% to 10%, suggesting many companies moved into the highest margin category.
The middle tier (10–15%) also declined slightly from 24% to 14%, while those in the lower brackets (less than 10%) fell significantly—from 20% in 2024 to just 2% in 2025. This shift suggests a few possibilities for why the middle-zone of profitability is slowly ebbing away. It could be from improved operational efficiencies, a more beneficial pricing power, or service bundling within the industry.
Where They Work
While it isn’t any surprise that the vast majority of the work mix was in parking lots, there were a total of three contractors in the Top 50 Sealcoating that exclusively performed all their jobs in parking lots.
- 66% (33) of contractors completed work on residential driveways at an average amount of 16% of total work composition
- 22% (11) of the companies did sealcoating on highways at an average rate of 17% of total work composition
- 100% (50) completed at least some parking lot sealcoating at an average rate of 64% of total work composition, down about 10% from last year.
- 76% of contractors performed work on residential streets and roads at an average rate of 24% of total work composition
- 54% (27) performed other work outside of these at a mix rate of 7%
Who Did They Work For
This year municipal work did see a small rise in the clientele mix, but, without a doubt, the commercial and industrial customers dominate the demand for this service. Additionally of note, the multi-family/HOA sector completely cratered this year from 22% (TC 2024) to just 3% this year:
- 100% (50) of contractors worked for industrial/commercial clients at an average 58% of sales composition
- 82% (41) of the Top 50 worked for municipal customers at an average 15% of sales composition
- 96% (48) worked for multi-family homes/apartment/housing associations at an average rate of 3% of sales
- 62% (31) did work for single-family residential clients at an average rate of 12% of sales
- 94% of the Sealcoating Top 50 completed some work as a subcontractor for someone else at an average rate of 23% of their gross total sales
- 16% (8) did work for "other" undefined types of clients outside of these at a mix of 18%
Fleet Replacement
- The number of contractors reporting it would require more than $2 million to replace their total fleet increased by one from last year to 29 companies. A decrease of 1 this year.
- 11 companies reported it would require between $1 - $2 million for replacement, also a reduction of 1.
- 4 reported between $500,000 - $1 million would be needed, which doubled last year.
- 6 reported needing less than $500,000 in all, an increase by 1 overall.


