The growth rate for the striping industry from TC 2024 to TC 2025 is marked by a significant increase in sales, rising from a fairly disappointing $90 million last year to $134.12 million for 2025. This reflects an approximate 48.9% increase from the previous year, indicating a robust recovery and growth in the striping segment.
Striping is booming though, not just numerically, but as an industry it continues to expand into new growth markets, new industries, and it's lower barrier to entry makes it somewhat more accessible to those interested in it as a business model. Out of all the categories for Top Contractor, this has probably been the least volatile, and the most resilient to outside factors.
This dramatic jump is noteworthy, especially considering the downward trend observed from 2022 to 2024, where sales were notably impacted by economic factors, including the post-pandemic recovery phase and potentially industry-specific slowdowns. Despite the sharp decline in 2024, the growth in 2025 highlights a possible rebound, signaling renewed demand and possibly larger projects or shifts in regional market dynamics that favor the striping sector.
 The graph above represents the striping-only sales for the Top 50 contractors from 2015 to 2025
When viewed over a longer horizon, the overall growth in the industry between 2015 and 2025 is clearly evident, with a compound annual growth rate (CAGR) of 1.82% per year, which is steady, healthy progress, not counting the fluctuations of the pandemic and its aftermath. Notably, the 2022 outlier at $534 million skewed the trend, creating an unsustainable spike. However, removing that anomaly reveals a more moderate growth trajectory, with a noticeable dip in 2021 due to pandemic disruptions.
Every year we have to address the outlier figure for 2022, and it bothers me, because we still use it as our published number, but we also know that what caused it was ultimately from an unverified financial survey. This happened before my time as editor, but I am going to correct it using the best method I can.
If we take the data from years 2015-2020, the Striping sector showed a growth rate of 12.74%. That's massive! It was going to the moon. Then the pandemic hit, and it hit so hard that if you add that year to the calculation, it tanks the CAGR down to -1.87%. If we split the difference, it gives us an average CAGR of 5.44%. If we recalculate the 2022 outlier year using this CAGR, and add a +/- 5% margin of error, that would bring the projected 2022 striping only sales to $110.71 million. A new graph with that figure looks like this:
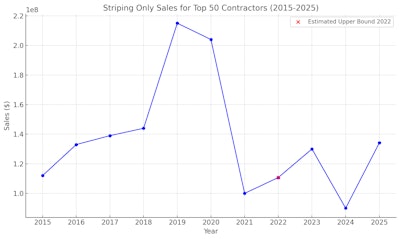
This will be the figure we use starting next year. This is a "normalized" version of the graph, extrapolating a reasonable striping only figure, based on the history of the sector up to that point, including the pandemic's impact.
Total Sales For The Striping Top 50
The total gross sales for all work done by the 2025 Top 50 Striping contractors came to $1.827 billion, a growth of $392 million from TC 2024's $1.435 billion, or approximately a 21% recovery. That's good news, after the contraction from TC 2023's $1.584 billion, which was a negative change of about $148 million.
Only one of the Top 50 Striping contractors received 100% of their revenue from striping, with the industry average coming in at 15.66% of their sales mix. Additionally, only 3 contractors made more than 50% of their revenue from striping only sales, meaning 92% of the Top 50 Striping contractors earned less than half their revenue from striping.
This has trended downwards over the last three years, which could mean a few things. It could possibly be the result of more sub contracting out by the top earners in the industry, and it could mean that the pricing has grown with the other industry categories, while costs remained flat. Let's take a look at the profit margins to add some more context.
Profit Margins
The profit margin distribution for the Striping Top 50 continues to be a fascinating sector to watch evolve every year. This year things continued their long-standing trend, and one we've seen start to emerge in other sectors like Sealcoating as well recently, where the middle of the herd is disappearing. I have a theory about this, but it's only a theory.
If striping has become increasingly subbed out by the larger contractors, it might overrepresent itself for the most well established companies as a high profit margin service, and then if smaller striping contractors were getting less work or work that was more competitive because of the more established companies, then it might explain why the middle is gone.
- Those who reported the highest profit margins, more than 20%, represented 36%% (18) of the field, a growth of 4% from TC 2024.
- The 16-20% profit margin range completely collapsed this year with only 12% (6) of the Top 50, compared to 22% (11) in TC 2024.
- Additionally, the 10-15% profit margin range dipped to 20% (10) from the 24% (12) of the Top 50 in TC 2024, continuing the multi-year trend from 28% in 2023 and 37% in 2022.
- The 6-10% range is where things start to grow again, up to 30% (15) from TC 2024's 20% (10).
- The lowest range of 5% and less remained flat at 2% year-over-year.
Type of Work
The mix of work is slightly misleading in this case, because it isn’t really a reflection of where the Top 50 Striping contractors did striping per se, but a breakdown of the places they completed any type of work. It’s still interesting, and worth taking a look at:
- 54% (37) contractors performed work on driveways, up 2% from last year, at an average rate of 9% of their work mix.
- 24% (12) of contractors completed some highway work, also up, and at an average rate of 18% of their work mix.
- Unsurprisingly, 100% (50) of contractors completed parking lot work at an average rate of 34% of their work mix composition, which was surprisingly a small drop of 3% of their mix.
- 82% (41) completed residential street projects, up 6%, at an average rate of 22%
- 46% (23) completed work in undefined “other” areas, more than double from last year, making up about 10% of their mix.
Customer Mix
- Same as last year, 100% (50) of contractors did work for commercial and/or industrial clients, at a rate of 57%.
- 86% (43) of contractors did work for municipalities at an average customer mix of 18%
- 90% (45) of the Top 50 completed work for multi-family, residential properties at an average mix of 22%
- 54% (27) of the list did some work for single-family residential properties at an average mix of 9%
- 14% (7) did work for "other" type of customers at an average rate of 18%
Number of Customers
- 24% (12) of contractors had more than 400 clients.
- 4% (2) worked with between 301-400 customers.
- 18% (9) had 201-300 customers.
- 14% (7) had between 151-200 customers.
- 22% (11) worked with 101-150 customers.
- 18% (9) with fewer than that 100.
Number of Jobs Completed
- 46% (23) of contractors in the Top 50 Striping completed more than 400 jobs last season.
- 20% (10) did between 301-400 projects.
- Only 10% (5) companies had between 201-300 jobs.
- 6% (3)completed between 151-200 projects.
- 14% (7) between 101-150 jobs.
- Only 4% (2) contractors made their earnings only less than 100 projects completed.
Fleet replacement
This is an extremely top heavy section of data.
- 2% (1) reported it would take less than $250,000 replace their company fleet.
- 6% (3) of contractors reported it would only take between $250,000-$500,000
- 8% reported it would require between $500K - $1 million
- 26% (13) would need between $1 million - $2 million
- A staggering 58% (23) would need more than $2 million to fully replace their current fleets, down from 64% last year.

