The 2023 Top Contractor results are in, and for the second straight year the data shows an increase in overall sales, while the number of participating contractors remained about the same as last year, resulting in lists of top 50 (as in 2022) instead of the usual 75 included in years past. The number of entries is still encouraging, however, considering that the application process underwent its biggest transformation ever.
For the first time ever, entries were taken only through an online submission process through our website home ForConstructionPros.com, and it will be the method going forward from this point on. Hopefully, this means that next year we will have enough participants to bring the lists back up to their original listing size.
The submission window will open in the month of December and then remain open through sometime in March, and will be more definitive once we get closer. You should make a note on your calendars if you missed the opportunity this year, but another thing you can do, is go and sign-up for our newsletters on the website. If you're already receiving them, make sure to open them up every month when they pop into your inbox, because we make sure to send out many notices and links directly to the online application.
For the 2023 Pavement Top 50 Contractors, total sales dollars were up again over last year, signifying that the industry remains in a growth period despite the effects of inflation depressing the economy in many ways, continued supply chain issues driving up material costs, and labor shortages causing headaches for everyone.
View the Striping Top 50 here.
View the Sealcoating Top 50 here.
View the Pavement Repair Top 50 here.
Overall Sales Dollars
We open up our analysis with overall sales dollars of the qualifying contractors which reached more than $1.544 billion. When compared to last year's total of $1.674 billion, and $1.096 billion in 2021, which represents an approximate contraction of ~8.5% versus the abnormally large ~62% growth the year before. While some might see this year's figure in a negative light, I think that there's it still represents a step in the right direction when you take into consideration the proper economic context.
That overall sales number represents the combined total of the segmented sales data for paving-only, sealcoating-only, striping-only, and repair-only work. In other words, it is comprised of the sales figures used to compile our four qualifying lists. No sales dollars are duplicated, and sales in the "other" category are also excluded from this sum.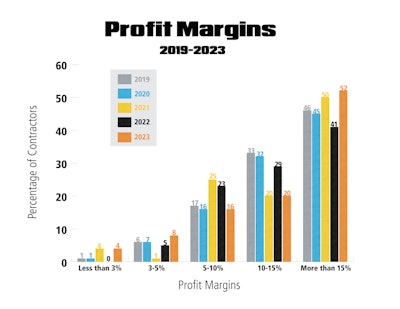
When you consider the effects of severe inflation experienced by the country in 2022, it's actually surprising that the market contraction wasn't steeper. The previous years 62% growth was an outlying figure due to the pandemic "rebound" and wasn't a very realistic number to expect repeating. This appears to be the market self-correcting. However, there are economic signifiers to be very optimistic about.
For instance, when it comes to total sales 2023 (which does take into account income from outside the four main categories) companies did quite well compared to 2022:
- Paving 50: $1.723 billion in total sales compared to $1.337 billion
- Striping 50: $1.583 billion in total sales compared to $1.132 billion
- Sealcoating 50: $1.59 billion in total sales compared to $1.61 billion
- Pavement Repair 50: $1.672 billion in total sales compared to $1.22 billion
Three out of four Top 50 lists saw significant total sales growth over last year, and the dip in sealcoating numbers is small enough that it could simply be that a handful of big sealcoating contractors didn't know submit through the new application process. This compared to the segmented-only sales data for 2023 versus last year:
- Paving-only sales increased to $913,190,892 from $742,226,477
- Striping-only sales dropped drastically to $129,954,003 from $534,425,922
- Sealcoating-only sales jumped to $186,110,524 from $150,346,312
- Pavement Repair-only sales increased to $315,056,146 from $247,572,610

Reported profit margins [see graph] were higher than they've been in the last five years for those earning at the top or bottom of the margin curve. Those reporting greater than 15% margins increased to 52% over just 41% a year ago. For middle margin earners, there was nearly a 10% drop off in the 10-15% margin group, and 7% decrease in those reporting 5-10% margins. However, the amount of contractors who's margins were 5% were the highest they've been.
The "Average" Top 50 Contractor
The overall total sales, including the "other" category outside the main four, came to $1.757 billion, and the average contractor generated just over $35 million in annual sales ($23 million last year and $14 million in 2021) from a diversified mix of paving and pavement maintenance work. This figure is a 34% increase in per-contractor sales, on average, over last year. The average revenue by segment breaks down like this:
Paving: 58% (62% last year)
Striping: 20% (18%)
Sealcoating: 22% (25%)
Pavement Repair: 20% (19%)
Surface Treatments: 2% (3%)
Other: 12% (11%)
By a fairly wide margin, concrete work is the most commonly cited service that contractor's provide in the answer box for "other" and after that it is fairly close between snow removal services and signage work. Additionally, drainage, decorative, bollard installation, excavating, and site-prep work were all listed at least once.
The average company spends 69% of its time on parking lots, 14% on streets, 12% on driveways, 1.5% on highways, and 4% on other (trucking, site work, excavation, parks, and pathways).
As for the types of customers this average contractor works for:
- 61% are for commercial clients
- 11% are municipal (state/local agency) customers
- 17% are apartment/HAO, multi-family properties
- 10% are single family/homeowners
- 1% were "other" which is a mix of utility company, private contractor work, and retail storefront.
In a significant decline from last year (24%), the average contractor generated only 17% of their revenue by working as a subcontractor.


