Curing sounds simple: it is the maintenance of moisture and temperature conditions in freshly placed concrete to promote the hydration of cementitious materials. When done correctly, curing helps a concrete mixture develop the engineering properties it was designed to achieve. When neglected, problems such as those mentioned above may result. Even if some of these problems aren’t observed right away, poorly cured concrete tends to have higher permeability at the exposed surface that makes it more prone to deterioration by mechanisms such as chemical attack or freeze-thaw damage years down the line.
Petrography and Curing
The effects of curing are most significant near the exposed surface of a construction element, such as the finished surface of a concrete slab or the formed surface of a vertical element. These surfaces are where moisture is lost to the atmosphere through evaporation and where the effects of extremes in ambient temperatures are strongest. The depth of the zone affected by curing most commonly ranges from 6-19 mm (¼-¾ in.) but may extend to depths of 50 mm (2 in.) in some cases (see Figure 3 in [1]). In our petrography practice we often see the depth of the zone affected by curing to range from 3-6 mm (⅛-¼ in.) in concrete slabs.
To evaluate curing petrographers look for clues that inform them about the degree of hydration, which is a measure of how much of the cement in a mixture actually reacts with water to form paste. By comparing these clues from near the exposed surface to a depth below the zone affected by curing (say 19 mm or ¾ in.), one can see how curing affected the degree to which hydration. Below we review some of them.
Degree of Hydration
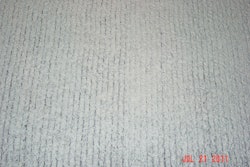
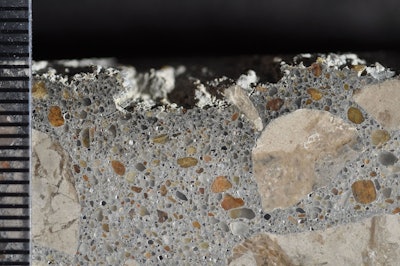
Petrographers often use color as a first cut indicator of the quality of curing. The paste darkens at the top of a slab when curing is poor because water evaporates before it reacts with the cement, effectively reducing the w/cm (Figure 1). Color is only a crude indicator of curing in slabs that receive a hard trowel finish because the mechanical forces associated with troweling will physically expel water from the paste, lowering w/cm also. Therefore it is critical to determine the relative contributions of these mechanisms in hard troweled slabs. When slabs are burnished, for example, the top layer of concrete tends to be quite rich in paste with minimal amounts of coarse sand particles (and no coarse aggregate), so the dark layer is clearly in large part a function of finishing, rather than curing. Other physical properties of the paste such as its texture, hardness and absorption give information regarding the degree of hydration and effects of finishing. The paste becomes more granular and more absorptive when hydration is restricted from poor curing. This generally results in softer, more friable paste that is scratched more easily (measured with Mohs hardness scale) than well-cured concrete.
Examining petrographic thin sections, which are pieces of concrete mounted on glass slides and ground to a thickness (~ 25 µm or 1 mil) to allow the transmission of light through them, is one of the most effective ways to evaluate curing. Thin sections allow petrographers to recognize unhydrated cement grains (UCG) in the paste based their optical properties, or the manner in which they transmit light. In poorly-cured concrete the concentration or packing of the UCG near the finished surface is greater than that observed at depth and the UCG are coarser or larger near the finished surface than at depth, indicating the hydration is restricted (Figure 2).
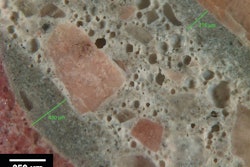
The scanning electron microscope is also an excellent tool for evaluating the degree of hydration. With this tool it is possible to obtain images of the paste at higher magnifications and with higher resolution than optical microscopes. Images made with backscatter electrons provide an indication of the average atomic number, or chemical composition, of a material. The heavier the material, the brighter it appears. Relict and residual cement grains tend to appear nearly white whereas voids appear black (Figure 3). Again, comparing the concentration and size of UCG from near the top surface to those at depth allow an evaluation of curing. These images are particularly useful for petrographic laypeople since its easier to differentiate between different shades of gray than trying to recognize materials based on their optical properties.
Supplemental Cementitious Materials (SCM)
Concrete mixtures that include significant amounts of SCM can present a challenge for curing because they react more slowly than portland cement. The reason for this is that a slower rate of reaction means there is more time for water to escape before it reacts with the SCM. The SEM can be particularly effective for recognizing when different types of cementitious materials respond differently to curing methods. Consider the example shown in (Figure 4). In this project significant frost scaling was observed after less than two years of service. The concrete was placed in late fall and the mixture called for 50 percent slag cement. The SEM images clearly showed much higher amounts of SCM than portland cement at the finished surface than at depth but comparable amounts of these materials at depth. This indicates that while curing measures were adequate to allow the hydration of the portland cement, they were insufficient for the slower-reacting slag cement.
Cracking and Microcracking
The frequency of shrinkage cracks and microcracks commonly increases with poor curing [5]. Petrographers can recognize and document hairline cracks (defined by widths of ~ 100 µm or 4 mil) and smaller microcracks related to drying shrinkage easily with a stereomicroscope. Microcracks related to drying shrinkage and poor curing cut sub-vertically from the finished surface to relatively shallow depths, pass around aggregate particles, and are free of secondary deposits. Crazing may also occur with poor curing. In many cases crazing may not be seen in the field but will be easily recognized in the lab with the application of a solvent such as acetone to a finished surface (Figure 5). It is important to remember that crazing by itself does not indicate something detrimental has occurred to the concrete due to poor curing. However, when observed with other features discussed here it builds the case for poor curing.
Carbonation
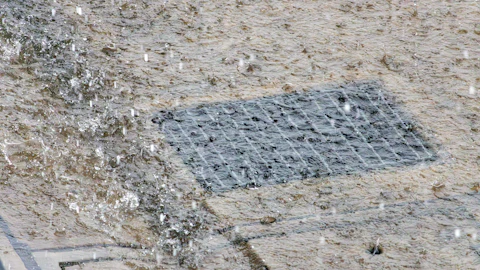
Poorly cured surfaces also tend to carbonate readily and this is usually detected relatively easily by phenolphthalein staining (Figure 6) and with a bit more effort thin section microscopy. We commonly see that in cold temperatures a thin, carbonated layer develops at the top of the slab. This likely occurs because cold temperatures at the surface slows the hydration reaction down so much that water evaporates before the cement can react with it. As a result, hydration is restricted, increasing the porosity of the paste and the rate and depth of the infiltration of carbon dioxide.
Fresh Frozen
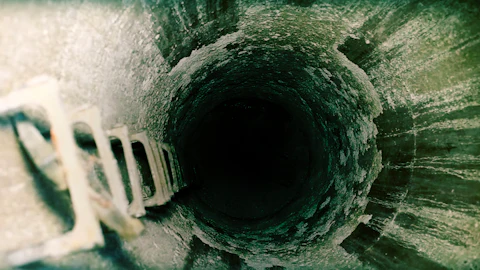
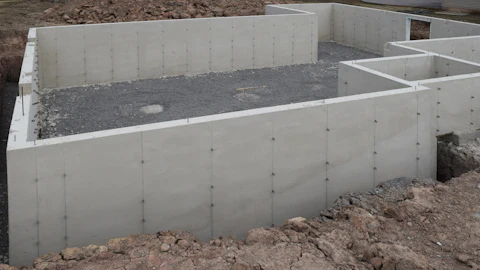
Concrete frozen in the fresh state probably represents the penultimate indicator and consequence of poor curing in cold weather (Figure 7). Even if measures taken to maintain moisture are done properly, proper curing demands maintaining adequate temperature conditions as well. Concrete that freezes while plastic develops a distinct and characteristic pattern of cracking and microcracking that will severely compromise the integrity of the concrete over the thickness of the frozen layer. These cracks and microcracks make a crows-foot pattern on the frozen surface. In extreme cases we have seen extensive cracking and microcracking extend for more than 50 mm (2 in.) into foundation walls that were inadequately protected from cold temperatures. This concrete also failed to develop adequate strength and had to be removed and replaced.
Crusting
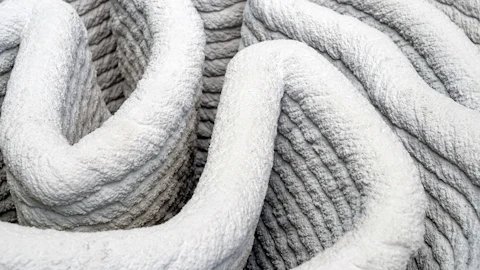
Concrete that crusts may represent the apex of poor curing in hot weather (Figure 8). Crusting usually occurs in very hot, dry and commonly windy conditions where the top surface of a slab rapidly loses moisture to evaporation. As a result the concrete becomes difficult if not impossible to work properly and is it often difficult if not impossible to texture the concrete properly. In many cases the effects of crusting can affect concrete to depths of 25-50 mm (1-2 in.). These zones are characterized by dark paste, cracks and microcracks and may show large bleed voids.
Conclusions
Curing is central to good concreting for a multitude of different reasons. Petrographers can evaluate curing from a number of different observations, ranging from relatively simple phenolphthalein staining to more sophisticated analyses using instruments such as the scanning electron microscope. When you need to engage a petrographer to evaluate curing (or almost any other problem), remember it is critical to supply the petrographer with as much of the big picture as possible. Information such as mix designs, trip tickets, weather data, job site reports regarding the curing practices and data from other tests can provide a context for evaluating what the petrographer sees and reports. With that, one can come to a better understanding of what happened and how to both fix it and move on and take measures to assure it does not happen in the future.
Ed. Note: David Rothstein, Ph.D, P.G., FACI is principal of DRP Consulting, Inc. (www.drpcinc.com), a firm located in Boulder, Colo., that specializes in petrographic and materials investigations.
References:
1. Basham, K., 2015, Curing Part I—Why Cure?, Concrete Contractor Magazine, Download at http://www.forconstructionpros.com/article/12151464/curing-part-i-why-cure
2. ACI 308R-01 Guide to Curing Concrete, Report by ACI Committee 308, American Concrete Institute, 2001, www.concrete.org
3. Kosmatka, S. H. & Wilson, M. L., Design and Control of Concrete Mixtures, 15th Edition, Portland Cement Association, 2011, www.cement.org
4. Taylor, P. C., Curing Concrete, CRC Press, Taylor & Francis Group, 2014, www.crcpress.com or www.talyorandfrancis.com