Keeping up with America's infrastructure is an extremely difficult task, and state-to-state the quality of the roadway management can vary wildly. Different bureaucratic red-tape, budgets, different taxes, climate and different geography are just some of the factors that can effect how well a state keep up with repairs, updates and new safety measures. Based on new data from Bureau of Transportation Statistics, which examined road conditions for each state by creating a ratio of total paved road miles to "acceptable" miles. This in-turn provides a percentage of how much of the given states drive-able infrastructure has been properly maintained. To get a final score, the fatality rate per 100 million vehicle miles traveled is combined with the daily person miles, the acceptable road ratio, and, finally, the change of condition over the last 5 years.
If you are a paving professional, ever wonder where your state comes in on the list? See if yours makes the top (worst) ten.
10. New Hampshire
Coming in a the best of the worst ten states is a New England state. Commonly known as the "granite state", and many people may not know that it has the shortest coastline of any state at 18 miles. But what you need to know about its roads is that the research discovered that only 76% of New Hampshire's roads were in an acceptable state, with a daily average mileage use of 34 miles per person. It might comes as no surprise then that when it comes to per mile government spending, the state ranks 3rd to last at $1,056 per mile. Final Score: 3.67
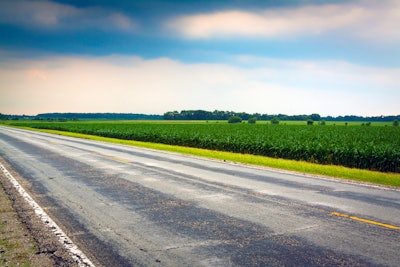
9. Montana
What is wild about how low Montana ranks in its road condition, is that it is has the lowest population density on this list. There are twice as many cattle in the state as there are people! Only 16 of its 56 total counties have enough development and people living on them to not be considered "frontier" by definition. Still, compared to New Hampshire, the state rank 44th in per mile spending at $1,1560, an increase over the rank 10. However, Montana is still worse off, because its fatality rate is nearly a half a point higher. Final Score: 3.54
8. Missouri
The gateway to the west. The city of St. Louis. BBQ and Budweiser. Missouri is known for a lot of things, and the "show me state" here is showing out to be the 8th worst state when it comes to their road system. Only 3/4 of their public roads were considered acceptable. What is a strange outlier is that Missouri falls in the upper half of states when it came to per mile spending, at $4,170 per mile, it might hint at some levels of mismanagement. At 13 percentage points below Montana in acceptable roads dragging down its score, Missouri does have a much lower fatality rate. Overall that is what drops it down on this list, because, all factors considered their final scores were exactly the same. Final Score: 3.54
7. Alaska
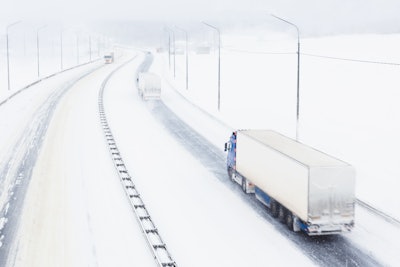
The great outdoors, it seems, does not make for great roads. Perhaps, that should not be too surprising when considering the fact that Alaska includes some roads that are actually made of ice. Despite a small 2% bump in overall acceptable road quality, Alaska boasts the highest fatality rate of any state so far, and a much lower per mile road expenditure of $2,162. Severe weather conditions and remote locations aren't a great combination. Final Score: 3.33
6. Louisiana
When you look up any state to see what they are best known for, almost all of them top the list with whatever food they are famous for. That is, except where I live, in Ohio, we don't have a famous regional food, unless you count Cincinnati Chili...and we do not count that...at all. However, Louisiana might be the center for American food heritage. Cajun and creole cooking is where it is at. However, building a society in a swamp, pretty well below sea level will complicate your road conditions. Only 74% of Louisiana's roads were considered in an acceptable condition, while unchanged over the last five years, their fatality rate is a full point higher than Alaska's, and the second most deadly on this list. Final Score: 3.26
5. Hawaii
If Alaska struggled because of its remoteness, then you had to know that Hawaii was going to be up further on this list. By far the single most remote location in the United States. It was a shock to me in high school when a teacher finally informed me that the island state was not, in fact, off the coast of California, as I had wrongly assumed for my entire life before that. Between active volcanoes, severe erosion from weather, and the difficulty with material resource acquisition, only 56% of public roads were deemed acceptable. However, what saves it from being the dead last state on this list, is having the lowest fatality rate (tied) out of the top 10, and the second lowest daily person miles. Final Score: 3.13
4. Mississippi
The birth place of American blues music, an agricultural powerhouse, and, also, the only state that has a universally known spelling-jingle that you already said to yourself in your head when you got to this state on the list. I know because I said it when I typed it out. Sadly, Mississippi is also the worst-off state economically in the entire country, but despite that, they only rank 36th in per mile spending at $2,624. What hurts their score the most, and effects its position on this list, is that it is the most deadly road system on the country. A fatality rate of 1.63 (per 100 million vehicle miles traveled). Final Score: 2.65
3. Arizona
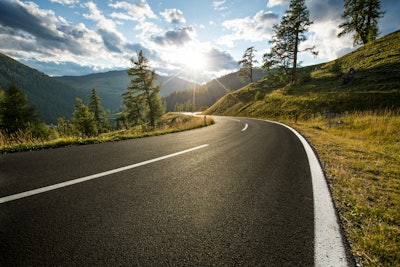
It is basically a dessert. Lots of the states on this list exist on some end of the climate extremes, but Arizona is certainly an interesting case study in extreme infrastructure conditions. Not to mention it has the Grand Canyon and the distinction of being famous for the visual archetype for the American West. While Arizona does sport the second best acceptable road ratio at 81%, it is the second most deadly in fatalities, and has the highest daily person miles at just under 50 per day. That's a lot of driving. Final Score: 2.24
2. New Mexico
I suppose the state that is, perhaps, best known for crashed UFOs, secretive military bases, and the world's first atomic bomb tests was destined to end up near the bottom (or top, I guess) of this list. However, New Mexico is a unique case study, in that, it isn't the worst at anything. It doesn't have an extremely low acceptability ratio, it doesn't have the highest fatality rate, and it is in the middle of the pack when it comes to daily per person miles driven at 35. New Mexico is just kind of bad at all of them equally. It is 41st ranked in per miles spending at $1,778 but even that isn't the worst on this list. Final Score: 1.43
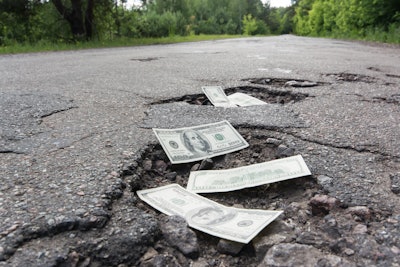 AdobeStock_252712250
1. West Virginia
Country roads, take me home...to the place - I BELOOOONG!! It couldn't have worked out better than if I planned it. Make a road joke with such a well known song in an article about the worst road in the country? That was too good to pass up. In all seriousness, though, the conditions in the state have seriously plummeted. West Virginia might be the state for lovers, but it isn't the state for drivers. Absolutely, the last state on the list, and 33rd in per mile spending at $2,933, it's biggest statistical factor was the wild -18% drop in acceptable miles of public road over the last five years. That could be attributed to a lot of things, but, maybe the most significant is climate change and the difficulty of the mountainous terrain. While not being out in the middle of the Pacific Ocean, it is still remote and frustratingly difficult to transport heavy machinery and materials where they need to go. The final score is not good, and West Virginia is going to have to work hard to rise up this list over the next five year period. Final Score: 0.68
Data for this list was compiled by Zutobi from statistical information collected and processed in a research study conducted by the Bureau of Transportation Statistics.




![Img 0125[59]](https://img.forconstructionpros.com/files/base/acbm/fcp/image/2022/10/IMG_0125_59_.633b3cac4d0be.png?auto=format%2Ccompress&fit=crop&h=167&q=70&w=250)
