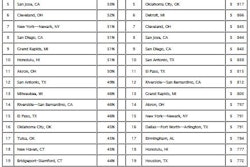
The Highway Trust Fund is set to expire on July 31. Without action from Congress, federal funding for transportation will come to a screeching halt. And with it, so will traffic in many places across the country.
Over the last six years, Congress has passed 33 short-term measures rather than funding transportation for the long term. And our transportation system — our roads and bridges, especially — is in a dire state of disrepair because of it. The U.S. Department of Transportation has created a table of state-by-state road and bridge conditions that demonstrates this.
Indiana has the lowest percentage of roads in poor or mediocre condition at 17% while Connecticut and Illinois tie for the highest percentage at 73%. The national average of poor road conditions is 48.82%.
On average, more than a quarter of bridges per state are deficient or obsolete. Rhode Island has the highest percentage of bridges deemed structurally deficient or functionally obsolete at 56.5% (433 bridges). Minnesota has the lowest percent with only 11.5% of its 13,137 bridges deemed structurally deficient or functionally obsolete.
The annual total extra vehicle repairs and operating costs due to driving on these poor roads is highest in New Jersey with an average of $601 per motorist. Georgia drivers are averaging the least with only $60 per driver. The national average is $300 per motorist.
Experts agree: The only way to prepare our transportation system for the next generation is to stop this cycle of short-term measures and pass a long-term transportation bill.
Top five states with highest percentage of roads in poor condition:
- Connecticut — 73%
- Illinois— 73%
- Wisconsin — 71%
- Colorado — 70%
- Oklahoma — 70%
Top five states with lowest percentage of roads in poor condition:
- Indiana — 17%
- Georgia — 19%
- Nevada — 71%
- Alabama — 25%
- Utah — 25%
Top five states with highest percentage of structurally deficient bridges:
- Rhode Island — 56.5% (433 of 766 bridges)
- Massachusetts — 52.5% (2,694 of 5,136 bridges)
- Hawaii — 43.9% (494 of 1,125 bridges)
- Pennsylvania — 42.2% (9,561 of 22,660 bridges)
- New York — 38.8% (6,775 of 17,442 bridges)
Top five states with lowest percentage of structurally deficient bridges:
- Minnesota — 11.5% (1,513 of 13,137 bridges)
- Arizona — 12.1% (954 of 7,862 bridges)
- Nevada — 13.7% (253 of 1,853 bridges)
- Wisconsin — 14% (1,970 of 14,088 bridges)
- Utah — 14.7% (437 of 2,974 bridges)
Top five states with highest per motorists extra costs for repairs from driving on deficient roads:
- New Jersey — $601 per motorist ($3.476 billion annually)
- California — $586 per motorist ($13.892 billion annually)
- Hawaii — $515 per motorist ($456 million annually)
- Rhode Island — $467 per motorist ($350 million annually)
- Oklahoma — $425 per motorist ($978 million annually)
Top five states with lowest annual extra costs (per motorist) for repairs from driving on deficient roads:
- Georgia — $60 per motorist ($374 million annually)
- Florida — $128 per motorist ($1.792 billion annually)
- Alabama — $141 per motorist ($530 million annually)
- Oregon — $173 per motorist ($495 million annually)
- Tennessee — $182 per motorist ($809 million annually)
Bridge data based on 2013 data from the Federal Highway Administration. Road condition data and extra cost data based on American Society of Civil Engineers 2013 Report Card for America’s Infrastructure.