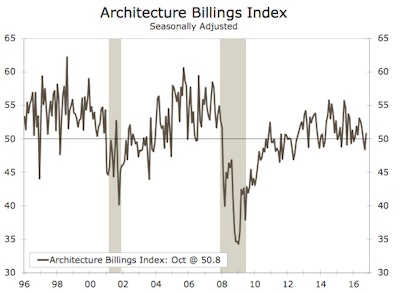
After seeing consecutive months of contracting demand for the first time in four years, the Architecture Billings Index (ABI) saw a modest increase demand for design services. As a leading economic indicator of construction activity, the ABI reflects the approximate nine to 12 month lead time between architecture billings and construction spending. The American Institute of Architects (AIA) reported the October ABI score was 50.8, up from the mark of 48.4 in the previous month. This score reflects a slight increase in design services (any score above 50 indicates an increase in billings).
The new projects inquiry index was 55.4, down sharply from a reading of 59.4 the previous month.
The three-month moving average remained below the break-even threshold for the second consecutive month, according to Wells Fargo Securities.
Wells Fargo also said design contracts, which is an early billings index that follows the authorization to proceed with design activity, slipped 2.7 points during the month to 48.7. That said, the three-month moving remained above 50, but the trend has been decelerating since its mid-2016 peak, suggesting billings could also slow.
“There was a collective sense of uncertainty throughout the design and construction industry leading up to the presidential election,” said AIA Chief Economist, Kermit Baker, Hon. AIA, PhD. “Hopefully we’ll get a sense of what direction we will be headed once we get a clearer read on how the new administration’s policies might impact the overall economy as well as the construction industry.”
By region, billings in the South grew in October to 53.7, with the index posting more than four years of readings above 50, according to Wells Fargo. Construction billing activity in the Midwest, North and West registered contractionary scores during the month. In fact, the Midwest posted its lowest mark in 10 months, falling 3.3 points to 46.8. The Northeast registered at 47.3 while the West came in at 49.7.
By sector, residential multifamily improved in October to 51.2, while commercial/industrial, institutional and mixed billings were weak at 49.8, 49.1 and 49.5 respectively. The weak trend suggests some slowdown in construction activity is imminent in the coming year, according to Wells Fargo. However, the American Institute of Architects noted the recent slate of lackluster scores is likely due to uncertainty around the presidential election.
Wells Fargo says the rebound in the monthly reading is consistent with nonresidential construction starts and the Dodge Momentum Index (DMI), which also rose in October. In a recent note, Dodge Data & Analytics remarked that the construction sector is at a mature phase of the cycle and a slower pace of growth should be expected. Wells Fargo says we can see this pattern in the value of construction spending put in place where the year-over-year pace in nonresidential outlays slowed from the double-digit growth notched in the second half of 2015 and early 2016 to just 4.1% in October. Yearly comparisons are going to be tough as the construction industry saw an influx of large projects come on line during this period.
Commercial construction outlays continue to lead the way, but the pace of institutional building is moderating, Wells Fargo adds. Institutional rose just 1.9% year over in October, with healthcare outlays falling for the fourth straight month. Although weakness in the sector is concentrated in medical building construction spending, improvement in hospital construction spending could stall given any pullback in the Affordable Care Act.
Manufacturing outlays fell almost 7% relative to a year earlier in October, with continued weakness in chemical and transportation equipment outlays, which comprise the largest components in the sector. We continue to look for the value of nonresidential construction spending put-in-place to rise in the mid-single digits next year.
The regional and sector categories are calculated as a three-month moving average, whereas the national index, design contracts and inquiries are monthly numbers.