January’s level of U.S. construction starts, excluding residential work, was $24.7 billion, an increase of 9.8% versus December, according to CMD. The nearly double-digit percentage increase was noteworthy since there is usually a December-to- January decline, due to seasonality, of 8.5%.
Compared with January of 2015, the latest month’s starts level was 12.9%. Relative to average nonresidential starts in January over the preceding five years, 2011 to 2015, the gain was 18.6%.
The starts figures throughout this report are not seasonally adjusted (NSA). Nor are they altered for inflation. They are expressed in what are termed ‘current’ as opposed to ‘constant’ dollars.
‘Nonresidential building’ plus ‘engineering/civil’ work accounts for a considerably larger share of total construction than residential activity. The former’s combined proportion of total put-in-place construction in the Census Bureau’s December report was 63%; the latter’s was 37%.
The latest Employment Situation Report from the Bureau of Labor Statistics (BLS) records an 18,000 increase (seasonally adjusted) in the total number of construction jobs in January, but that fell short of the pick-up in each of the final three months of 2015. December was 48,000, November 65,000 and October 33,000.
Year-over-year employment in construction in January was 4.2%, more than double the rate for all jobs (1.9%), but the pace of increase has been decelerating since December 2014’s 6.1%. Construction’s not-seasonally adjusted unemployment rate in January was 8.5%. In January 2015, it had been 9.8%; in January 2014, 12.3%; and in January 2013, 16.1%.
Total jobs in architectural and engineering services in January were 0.2% month to month and 2.3% year over year. They are approaching, but have not yet reached, their pre-Great Recession peak.
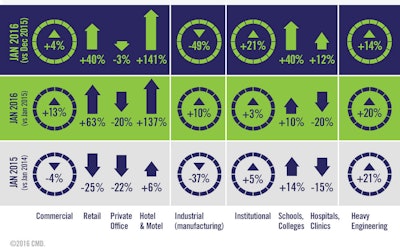
All three major type-of-structure categories managed month-to-month starts increases in January. Institutional (21.3%) was the leader, followed by heavy engineering/ civil (13.6%), with commercial (3.8%) also ahead, but to a modest degree. The normally smaller-dollar-volume category of industrial/manufacturing (-49.1%) fell back by almost half, but it can swing wildly from one month to the next, based on whether or not there is a go-ahead for a mega project.
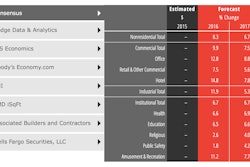
Comparing standalone January 2016 with its counterpart in 2015, there were increases in all categories. Engineering (20.1%) recorded the largest leap forward, followed by commercial (13.2%) and industrial (10.3%). The improvement in institutional (2.6%) was restrained.
Within engineering starts in January, ‘road/highway’ work was dominant, accounting for nearly 50% of the category’s total. Such street starts, in the latest period, were 42.8% month to month (m/m) and 39.3% year over year (y/y). ‘Water and sewage’ work is the second-largest sub-component of engineering and in January, it was -0.2% m/m, but 9.2% y/y.
Also significant in the civil category, ‘bridge’ starts were 6.3% m/m and 56.1% y/y.
The ‘hotel/motel’ and ‘retail/shopping’ sub-components tied for largest dollar volumes in the commercial category. The former was an outstanding 141.1% m/m and 136.7% y/y, while the latter also impressed with 40% m/m and 63.1% y/y.
Private office buildings continued to disappoint, -3.4% m/m and -20.3% y/y, but government office buildings quickened their pace, 66% m/m and 65.2% y/y.
Accounting for nearly 60% of institutional starts in January, the ‘school/college’ subcategory was 39.7% m/m and 10.2% y/y. ‘Hospital/clinic’ work accounts for the next biggest slice of institutional projects and in January, it was 11.8% m/m, but -19.7% y/y.
Across all structure types, there were four subcategories that performed much better in the kick-off month of 2016 than on average during January of the previous five years:
- ‘Hotels/motels’, 227.7%
- ‘Roads/highways’, 52.4%
- ‘Bridges’, 51.8%
- ‘Warehouses’, 34.3%
The ‘Top 10’ projects are widely dispersed geographically. Ten states are represented. In other words, no state accounts for more than one groundbreaking. Also, unlike some earlier months, there were no individual projects that topped $1 billion in value.
The economy-wide unemployment rate in January tightened to 4.9%. Year-over-year compensation increases were a consistent 2.5% hourly and weekly, both for all workers and excluding supervisory personnel. Omitting bosses, the construction sector’s wage hikes were a little slower, 1.6% hourly and 1.9% weekly. Including them, its earnings gains rose to 2.1% hourly (still slower than for all jobs), but 2.9% weekly (faster than for all jobs).
The value of construction starts each month is summarized from CMD’s database of all active construction projects in the U.S. Missing project values are estimated with the help of RSMeans’ building cost models.
CMD’s nonresidential construction starts series, because it is comprised of total-value estimates for individual projects, some of which are ultra-large, has a history of being more volatile than many other leading indicators for the economy.