Last year participation in Pavement Maintenance & Reconstruction’s Top Contractor Survey jumped 30% to the greatest number of companies since the survey was begun in 2013.
Unfortunately, this year participation declined to the point where we felt it was necessary to reduce each list from 75 to 50 companies—the same number we listed in 2017. Why the fluctuation in participation? We wish we knew. Pavement accepts completed surveys from Jan. 1 through April 23, and we promote it heavily via social media, e-mail and in this magazine in the first three issues of the year. We do require some specific information to be provided (this year we rejected more than two dozen incomplete surveys), and we do require third-party verification of the gross sales dollars each company reports. Perhaps that is the impediment.
But regardless of the reason, we offer the Paving 50, Sealcoating 50, Striping 50 and Pavement Repair 50 for 2019 – along with some industry insights resulting from the information these companies provide. Throughout this report we will reference the 2017 Top Contractor results, the most recent year the lists contained 50 companies each, because that provides a more apples-to-apples comparison. Results of other years will be included as well.
Overall Sales Dollars
The first place we’ll start is overall sales dollars of the qualifying contractors, which reached more than $1.055 billion; That compares to $910 million in 2017 when lists also were made up of 50 companies.
That overall sales number represents the combined total of only paving-only, sealcoating-only, striping-only, and repair-only sales – in other words the sales figures used to compile our four lists. No sales dollars are duplicated, and any sales relegated to the “Other” sales category also are not included.
Given the smaller lists, the overall 2019 sales figure certainly hints at a strong and busy market. While it doesn’t compare with the $1.717 billion of 2015 (when each list contained 75 companies and the economy was still coming out of a recession with pent-up work being completed), it does compare favorably to both 2016 ($1.188 billion) and 2018 ($1.214 billion) when each list contained 75 companies. (It also hints, not surprisingly, that there is a drop off in company size as we near the 50-company cutoff point.)
The “Average” Top 50 Contractor
Taking into account all the companies participating in this year’s survey, the average contractor generates just over $14 million in annual sales from a true mix of paving and pavement maintenance work. The average revenue by segment breaks down this way:
- Paving, 33%
- Sealcoating, 24%
- Striping 20%
- Repair, 12%
- Sweeping, 3%
- Other, 8%
The “Other” category is extremely broad but often includes excavation, drainage, concrete, traffic control or sports courts. The average company works 64% of its time on parking lots, 15% on streets, 14% on driveways, 5% on highways and 2% “Other.”
As for the customers this average contractor works for:
- 56% are commercial clients
- 16% are multi-family properties
- 15% are municipal customers
- 11% are single-family homeowners
- 2% is “other” (a mix of park district, cemeteries, golf courses etc.)
The average contractor generates 22% of revenue from work as a subcontractor, with figures ranging from 1% to 85% (though a small number of contractors don’t work as a subcontractor at all).
Other Findings for 2019
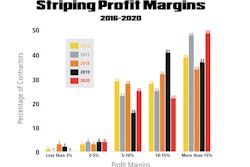
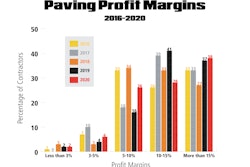
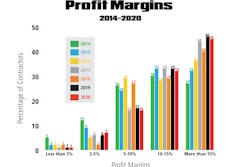
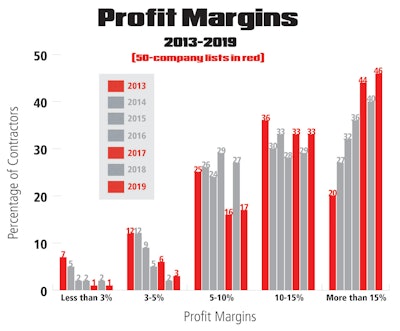
Overall Profit Margins. We’ll report profit margins for each industry segment in the introduction to each segment in the following pages, but the chart on this page provides a look at the overall range of profit margins for all companies responding to the survey, whether they qualified for a list or not.
As the chart shows, there continues to be a broad range of profit margins with which contractors are working. This holds true for each of the industry segments as well. But what is clear is that the 2019 profit margin results reinforce the trend that margins continue to move in the right direction.
Only 1% of respondents indicated they earn less than 3% margin (down from 2% last year and the same as 1% in 2017). In the 3-5% range, 3% of contractors report they fall into that range, and while that’s an increase over 2% last year, it’s a significant decline from the 6% who reported profits in the 3-5% range in 2017.
Last year the biggest change was in the 5-10% margin category, which jumped from 16% to 27% -- a movement of 9% in the right direction. That same category exhibited the biggest and most-significant change this year as well – but the change was in the opposite direction.
Contractors reporting margins in the 5-10% range actually dropped 10% to 17% this year. On the face of it that might seem like a problem – until you realize that those 10% of companies were part of the shift to even higher margins. Contractors reporting margins of 10-15% rose to 33% -- the same percentage as in 2017 – and up from 29% in 2018. Contractors reporting margins of greater than 15% rose to 46% -- up from 44% in 2017 and from 40% last year.
Clearly the profit margins of the industry, as a whole, continue trending in the right direction.
Do Larger Companies = Larger Margins? In 2017, the last year we published lists of 50 contractors each, 77% of contractors reported margins greater than 10%; that number declined to 69% in 2018 but rose to 79% this year.
When the number of companies on a list are reduced from 75 to 50, the companies that are left off are the smaller firms. It’s certainly likely that by limiting each list to 50 companies the companies we removed are mid-margin companies – which partly explains the tipping toward the higher margins. A quick comparison of the 2017 results with the 2019 results bears this out.
Replacement Value of Equipment. While the pavement maintenance business has been viewed as an industry with a low-cost barrier to entry, particularly in the sealcoating, striping and possibly repair segments (though few contractors start out as “repair specialists”), the contractors that make up these lists have significant investments in their fleets. Survey results indicate that:
- 4% could replace their fleet for less than $250,000
- 14% for between $250,000-$500,000
- 22% for between $500,000-$1 million
- 20% for between $1 million-$2 million
- 40% for more than $2 million
Number of Jobs. Results continue to indicate that contractors are on the go throughout the (often too-short) season. Two-thirds (66%) complete more than 200 jobs, with 45% completing more than 400 jobs. Almost one-quarter (23%) perform fewer than 150 jobs.
- 9% perform less than 100 jobs
- 14% perform between 101-150 jobs
- 11% perform between 151-200 jobs
- 11% perform 201-300 jobs
- 10% perform 301-400 jobs
- 45% perform more than 400 jobs
Number of Customers. The number of customers contractors perform those job for indicates they often obtain multiple projects from the same customer – a good sign for those pursuing relationship building as a means of growth. A little over half (56%) work for fewer than 200 customers, while 25% work for more than 400 customers
- 22% work for fewer than 100 customers
- 25% work for between 101-150 customers
- 9% work for 151-200 customers
- 11% work for 201-300 customers
- 8% work for 301-400 customers
- 25% work for more than 400 customers
Diversification Reaffirmed
The snapshot of the “average” contractor (and the 2019 lists themselves) reaffirm what these lists have been telling us since we started them in 2013: Contractors are not only becoming more and more diversified, but diversification leads to growth. Almost all companies on all the lists perform a variety of services for their customers:
- None of the Paving 50 provide only paving services (two generate 90% or more from paving)
- None of the Sealcoating 50 provide only sealcoating (one generates 90% or more from sealcoating)
- One Striping 50 company provides only striping services (two generate 98% and two more generate 90% or more from striping)
- None of the Pavement Repair 50 provide only repair services (no surprise there and only three generate 50% or more from pavement repair)
So larger contractors see value in diversifying. This is one of the biggest changes the industry has undergone since Pavement first published in October 1986 when many if not most contractors offered one or possible two services.
Why Contractors Diversify
Simply put, diversification provides balance. It enables a contractor to adapt more easily to a shifting economy, to adjust to changes in the local market (if, for example, new construction declines so the contractor has to rely on repair and reconstruction work), and a broad service offering can help a contractor compete.
In addition, diversification often involves bringing in-house work the contractor has hired others to do for him. The end result of that is more dollars are retained in the company instead of being paid out to others.
Plus, offering a broader variety of services enables a contractor to generate more dollars from each customer – potentially making each customer that much more profitable. And by offering more services to each customer contractors can become more valuable to their customers, strengthening the contractor/customer relationship and possibly making subsequent projects no-bid for their customers.
And these years of Top Contractor results indicate consideration of diversifying shouldn’t stop at the services offered. Take a look at the Customer Mix and the Where We Work categories in any of the lists on the following pages and it’s obvious that these contractors work not only offer a variety of diverse services, but they offer them to diverse group of clients and on a diverse group of pavement locations.
So, diversification isn’t restricted to only the services offered, it extends to these contractors’ approach to their market. And it seems to work; the contractors with the greatest sales volume (the contractors who qualified for these lists) are diverse in the types of services they offer, who they work for, and where they do their work.
Does diversifying – in whatever form – have its own challenges? Of course. But the results of seven years of survey results indicate that diversification in its many aspects is something contractors should consider for increased revenue, improved bottom-line numbers, stability and growth.
What Happened to the Specialists?
Oh, they’re still out there…probably. We’re defining a “specialist” as a contractor who focuses on one or mainly one service. As referenced above, when this magazine started in 1986 most contractors specialized in one or possibly two services. Most pavers didn’t stripe, most stripers didn’t pave; Sealcoating and striping were likely to go hand in hand, but even many of those companies didn’t repair potholes or cracksealing pavements – instead leaving those services to the paving guys.
That is no longer the case, but that doesn’t mean there aren’t companies out there who specialize in one service. Those that do (stripers are probably the best example) likely generate a significant portion of their work by subcontracting (with pavers and sealcoaters, for example). This enables those contractors to get on to the next paving or sealcoating job without having to wait or devote a crew to striping to get the job done.
Depending on the business model, this is a valid way contractors go about their business, and it means there are probably plenty of “specialists” out there. Why aren’t they on these lists? One reason might be that the specialists are smaller companies that simply don’t qualify based on their sales volume. Another possibility is that since participation in these lists is voluntary some larger specialists don’t participate. And the fact that we do require verification of sales dollars is a hoop some contractors just don’t want to go through.