The 2020 Top Contractor results took a huge – and we mean huge – leap forward in sales volume as a number of large contractors saw fit to participate in the survey.
The impact is that overall sales volume of all lists jumped significantly – so significantly, in fact, that year-to-year comparisons will be very difficult. Segment-only sales rose as well, especially in the Paving 50 list. Sealcoating 50 and Pavement Repair 50 segment sales rose, but Striping 50 sales declined.
Here’s an overview of the Paving 50, Sealcoating 50, Striping 50 and Pavement Repair 50 for 2020 – along with some industry insights resulting from the information these companies provide.
Overall Sales Dollars
We start with overall sales dollars of the qualifying contractors, which reached more than $1.316 billion. That compares to $1.055 billion last year and to $910 million in 2017.
That overall sales number represents the combined total of only paving-only, sealcoating-only, striping-only, and repair-only sales – in other words the sales figures used to compile our four lists. No sales dollars are duplicated, and any sales relegated to the “Other” sales category also are not included.
Why the large jump of more than $260 million dollars? A number of large contractors – specifically paving-focused contractors – participated this year, which had a significant impact not only on overall sales volume but on paving sales volume in particular.
All lists saw an increase in overall sales – in other words the total sales of all the work contractors qualifying for lists increased:
- Paving 50: $1.611 billion total sales compared to $1.046 billion in 2019
- Striping 50: $1.536 billion total sales compared to $1.070 billion in 2019
- Sealcoating 50: $1.271 billion total sales compared to $977 million in 2019
- Pavement Repair 50: $1.360 billion total sales compared to $981 million in 2019
And there was an increase in segment-only sales for three of the four segments as well.
- Paving-only sales rose to 832,921,050 from $493 million in 2019
- Sealcoating-only sales rose to $161,001,568 from $137 million in 2019
- Pavement Repair-only sales rose to $217,721,018 from $209 million in 2019
The only list where segment-only sales decline was the Striping 50, which saw a drop from $215 million last year to more than $204 million this year.
Surely some of this was growth in the industry, good economy and contractors having good years, but just as certainly part of the increase in sales resulted from large contractors participating in the survey for the first time.
Clearly the new companies joining the list are paving-focused operations. Their impact on the overall sales for the Paving 50 and paving-only sales is substantial. And it’s certainly reasonable they have an impact on overall sales and segment-only sales for sealcoating and pavement repair, too. Many contractors provide all those servers.
What’s interesting is the impact the paving-focused large companies had on the Striping 50. Note that overall sales for the Striping 50 jumped almost $500,000 – yet the striping-only sales was the only segment that experienced a decline.
We can speculate on the reason for that: As is evident, paving-focused operations exhibit high overall sales volume – but the likelihood exists that they don’t do much of their own striping. So the overall volume doesn’t translate to the segment-only volume. In fact, only 39 of the Paving 50 generate revenue from striping – and 14 of those contractors generate less than 5% of revenue from striping.
The “Average” Top 50 Contractor
Taking into account all the companies participating in this year’s survey, the average contractor generates just over $22 million in annual sales ($14 million last year) from a diversified mix of paving and pavement maintenance work. The average revenue by segment breaks down this way:
- Paving, 33% (33% last year)
- Sealcoating, 21% (24%)
- Striping 18% (20%)
- Repair, 14% (12%)
- Sweeping, 3% (3%)
- Other, 11% (8%)
Concrete work is the most-common service cited in the “Other” category, which also includes surface treatments, hot mix asphalt production, excavation, drainage, traffic control or sports courts. The average company works 64% of its time on parking lots, 19% on streets, 12% on driveways, 4% on highways and 1% “Other” (paths, sports courts).
As for the customers this average contractor works for:
- 57% are commercial clients
- 18% are multi-family properties
- 15% are municipal customers
- 9% are single-family homeowners
- 1% is “other” (a mix of park district, cemeteries, golf courses etc.)
The average contractor generates 21% of revenue (22% last year) from work as a subcontractor, with figures ranging from 1% to 90% (though a small number of contractors don’t work as a subcontractor at all).
Other Findings for 2019
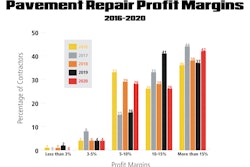
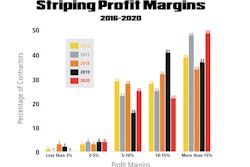
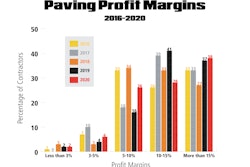
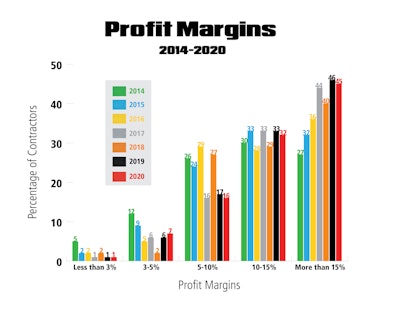
Overall Profit Margins. We’ll report profit margins for each industry segment in the introduction to each segment in the following pages, but the chart on this page provides a look at the overall range of profit margins for all companies responding to the survey, whether they qualified for a list or not.
As the chart shows, there continues to be a broad range of profit margins with which contractors are working. This holds true for each of the industry segments as well. But what is clear is that the 2020 profit margin results reinforce the trend that margins continue to move in the right direction.
- 1% of respondents indicated they earn less than 3% margin (the same as last year and 2017)
- 7% reported margins in the 3-5% range (3% last year; 6% in 2017)
- 16% report margins in the 5-10% range (17% last year; 16% in 2017)
- 32% report margins in the 10-15% range (33% last year; 33% in 2017)
- 45% report margins greater than 15% (46% last year; 45% in 2017)
Replacement Value of Equipment. While the pavement maintenance business has been viewed as an industry with a low-cost barrier to entry, particularly in the sealcoating, striping and possibly repair segments (though few contractors start out as “repair specialists”), the contractors that make up these lists have significant investments in their fleets. Survey results indicate that:
- 6% could replace their fleet for less than $250,000
- 11% for between $250,000-$500,000
- 20% for between $500,000-$1 million
- 15% for between $1 million-$2 million
- 48% for more than $2 million
Number of Jobs. Who knows what next year’s survey results will show, given the COVID-19 impact on the economy, but last year contractors were busy folks: 67% completed more than 200 jobs, with 45% completing more than 400 jobs. More than one-quarter (26%) perform fewer than 150 jobs (again, larger contractor might influence this as well as they might be taking on larger, longer-term projects).
- 10% perform less than 100 jobs
- 16% perform between 101-150 jobs
- 7% perform between 151-200 jobs
- 8% perform 201-300 jobs
- 14% perform 301-400 jobs
- 45% perform more than 400 jobs
Number of Customers. The number of customers contractors perform those job for indicates they often obtain multiple projects from the same customer – a good sign for those pursuing relationship-building as a means of growth. A little under half (49%) work for fewer than 200 customers, while 27% work for more than 400 customers.
- 27% work for fewer than 100 customers
- 14% work for between 101-150 customers
- 8% work for 151-200 customers
- 13% work for 201-300 customers
- 11% work for 301-400 customers
- 27% work for more than 400 customers