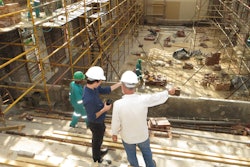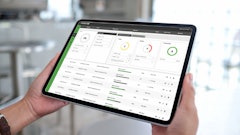
Monitoring multi-location construction projects is a multi-faceted task that may involve several people. When monitoring such projects, the list and nature of tasks increase, making the task complex. However, project managers can effectively monitor projects with the right tools and techniques.
Managers should be involved right from the planning stage to monitor construction projects effectively. According to FinancesOnline, 54% of project managers don't have real-time project Key Performance Indicators (KPIs).
Here are five ways managers can monitor multi-location construction projects:
1. Network Diagrams
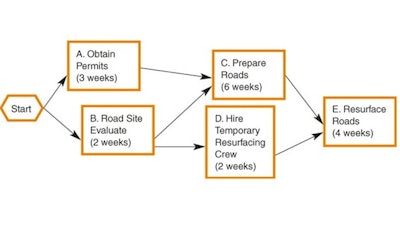
Network diagrams are an essential tool in project monitoring and evaluation. These diagrams consist of arrows used to connect the activities involved in a construction project. The arrows show interdependencies between different project activities. In these diagrams, an arrow links a preceding and the following activity.
 slideplayer.com
However, network diagrams are based on assumptions. The basic assumption of network diagrams is that team members must complete all the ongoing and pending activities before beginning new ones.
Another assumption is that the arrows in a network diagram indicate a logical priority. This assumption means that the arrow's direction displays a unique sequence that workers should follow to execute the activities. Network diagrams also assume that each project must begin and end with a single activity.
Each specific activity in a network diagram has a total of four dates. These dates enable project managers to calculate the total duration of the project. Each activity has two start dates and two end dates.
The dates indicate the earliest time that activities can begin and end. They also indicate the latest start time each activity can begin or end without affecting the completion of the project.
Another key date in network diagrams is slack time, which is the time an activity can be delayed. Despite the assumptions, network diagrams are essential tools in monitoring the progress of projects.
2. Critical Path Method (CPM)
CPM is an essential tool used by managers to assess and monitor the progress of construction projects in real-time. As a result, this tool ensures that all ongoing multi-location construction projects are completed on time.
 designingbuildings.co.uk
The critical path is the longest order of activities on a network diagram. The unique characteristic of the activities on the critical path is that they have zero slack time. Therefore, a delay in any activity in the critical path will cause a delay in the entire project.
Zero slack time is terrible because it does not allow any delay of critical activities. However, it allows project managers to be more vigilant because they understand that the slightest error can delay the entire project.
CPM allows managers to divert resources from one project to another if they need to. Such diversion ensures that managers allocate resources exactly where they are important, ensuring that no project is delayed.
However, diverting resources may also change the critical path of a project. Therefore, project managers must ensure that the activity they are diverting resources from does not become a critical path activity. Reducing the resources of a specific project may result in more time needed to complete it.
3. Gantt Charts
A Gantt chart is a graphical representation of all the activities relating to your project schedule. These charts are used to plan and monitor multi-location projects of all shapes and sizes.
 proofhub.com
Gantt charts are incredible tools for showing scheduled tasks for a project for any specific day. They show the entire term of a specific project in a single simple view. In addition, Gantt charts help simplify complex projects.
These charts convert project activities and timelines into horizontal bar charts. Each horizontal bar chart shows the start and end date, dependencies, deadlines, and scheduling. The bars also indicate the task owners and the current status of task completion.
Gantt charts are ideal for monitoring multi-location projects with the following features:
- Known start and end dates for each project
- What the project activities are
- The team members undertaking each project
- Workers involved in each individual activity
- The duration of each individual activity
- How the activities are dependent and interlinked with each other
You can integrate Gantt charts with project management solutions to give project managers visibility and more accurate scheduling. Managers can assess team workloads, as well as current and future availability.
4. Project Evaluation and Review Technique (PERT)
PERT is a type of network diagram that project managers use to determine the critical path. This tool creates realistic estimates of each activity duration, making it easier to schedule complex construction projects.
 proofhub.com
This type of network diagram uses three forms of time estimates rather than a single one. The first time estimate, known as optimistic time, assumes that all factors related to the activity will favor it. As a result, the activity will not delay.
The most likely time is the second estimate, which assumes that the activity will encounter some challenges during execution. This estimate provides some emergency buffers to fix the challenges.
The last estimate, pessimistic time, assumes that all the factors that can possibly go wrong will go wrong. As a result, the challenges completely delay the activity.
PERT helps managers maximize the utilization of resources. In addition, the technique can assist managers in crashing the critical path. Crashing means that managers can employ more resources to reduce the time needed to complete a critical path. As a result, crashing the critical path eventually reduces overall project duration.
5. Work Breakdown Structure (WBS)
 wisdomjobs.com
When all these details are displayed in a simple format, all the stakeholders can understand the project's scope. WBS also helps team members understand precisely the activities that need to be done.
WBS divides project deliverables and activities into small components that are easy to manage. These small components are known as work packages. Managers can easily monitor, assess, control, and estimate the cost of each work package.
A well-structured WBS with project management knowledge areas and process groups, which include:
- Project planning
- Project budgeting
- Project scheduling
- Risk management
- Team management
- Task management
- Resource management
The tool will also assist in avoiding common project management challenges such as cost overrun, scope creep, and missed deadlines.
Effective project managers will leverage these project monitoring tools. In addition, a combination of two or more of these tools could be more effective in monitoring complex construction projects. However, the ideal tool will also depend on the nature of the projects. Therefore, managers should determine what tools will give them optimal results.
 slideplayer.com


