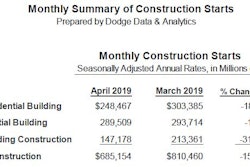
New construction starts in June advanced 9% from the previous month to a seasonally adjusted annual rate of $832.7 billion, according to Dodge Data & Analytics. The increase followed the 10% gain reported for May, as total construction starts continued to strengthen following April’s subdued performance. By major sector, much of the lift in June came from a 16% jump for nonresidential building, which reflected the start of the $1.1 billion expansion to Terminal 5 at Chicago’s O’Hare International Airport, as well as sharp gains for office buildings, public buildings (detention facilities and courthouses), healthcare facilities, and warehouses.
The other two major sectors registered moderate growth in June, with nonbuilding construction up 6% and residential building up 5%. Through the first six months of 2019, total construction starts on an unadjusted basis were $378.8 billion, down 8% from the same period a year ago. On a 12-month moving total basis, total construction starts for the 12 months ending June 2019 were 4% below the amount for the 12 months ending June 2018.
[AUDIO] Dodge Data & Analytics June 2019 Construction Starts
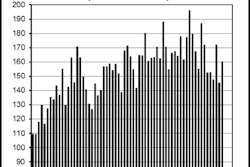
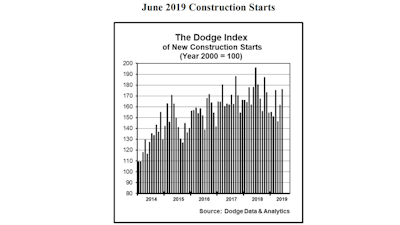
June’s data raised the Dodge Index to 176 (2000=100), compared to an upwardly revised 161 for May. June’s reading was the highest so far for the Dodge Index during 2019, topping the 175 for March, and coming in slightly above the full year 2018 average for the Dodge Index at 172. On a quarterly basis (which helps to lessen the volatility present in the monthly data), the Dodge Index edged up 1% during the second quarter of 2019, helped by the improved activity in May and June after a weak April. This followed a 7% decline during this year’s first quarter compared to the final three months of 2018. “On balance, the pace of construction starts has been sluggish so far in 2019, as activity has been generally lower than the healthy amount reported during the first half of 2018,” stated Robert A. Murray, chief economist for Dodge Data & Analytics. “The improved activity during May and June suggests that the gap relative to last year should narrow in coming months.”
“Several features of the first half of 2019 stand out, as shown by the construction start statistics,” Murray continued. “For nonresidential building, the commercial and institutional building segments have stayed close to their 2018 amounts, but manufacturing plant construction has not seen the same number of very large projects that were reported last year.
For nonbuilding construction, electric utility starts have witnessed renewed growth after several years of decline; but public works construction was generally lackluster in early 2019, and the dollar amount of new pipeline projects is down considerably from last year.
For residential building, single-family housing remains generally flat, adversely affected by affordability constraints. In addition, multifamily housing has lost momentum following its 2018 rebound, yet the occasional strong month like June suggests that this year’s multifamily pullback is likely to stay moderate.
 Dodge Data & Analytics
Nonresidential building in June was $308.3 billion (annual rate), up 16% which followed an 8% increase in May. The institutional building categories as a group soared 37% in June, helped in particular by a 348% jump for new transportation terminal starts.
Leading the way for transportation terminal projects was the $1.1 billion expansion of Terminal 5 at Chicago’s O’Hare International Airport that was entered as a June construction start. In addition, the latest month included the $370 million Terminal E modernization project at Boston’s Logan International Airport, a $98 million terminal renovation project at San Francisco International Airport, and a $75 million terminal renovation project at Dallas-Ft. Worth International Airport.
The public buildings category also had a strong June, advancing 242% as the result of these large projects:
- $320 million Wayne County Criminal Justice Center in Detroit
- $280 million Community Justice Campus in Indianapolis
- $163 million courthouse in Austin, TX
Healthcare facilities climbed 22% in June, featuring the start of six hospital projects valued each at $100 million or more that were led by the $305 million Altru Hospital in Grand Forks, ND, and the $245 million University of North Carolina Hospital Surgical Tower in Chapel Hill, NC.
Educational facilities, the largest institutional building category, edged up 1% in June as it registered growth for the third straight month. There were four high school buildings valued each at $100 million or more that reached groundbreaking in June, located in Richmond, TX, ($158 million), Wilkes-Barre, PA, ($137 million), Ames, IA, ($137 million), and Falls Church, VA, ($108 million). The top five states in terms of the dollar amount of educational facility projects that reached the construction start stage during the first half of 2019 were Texas, California, New York, Massachusetts and Ohio.
Decreased activity in June was reported for amusement-related projects, down 7%, and religious buildings, down 43%.
The commercial side of nonresidential building increased 12% in June. The office building category advanced 31%, boosted by the start of these large data centers:
- $418 million Microsoft data center in Cumming, IA
- $280 million data center in Papillion, NE
- $258 million data center in Manassas, VA
- $260 million AmerisourceBergen headquarters in Conshohocken, PA
- $230 million office portion of the $300 million Avocet Tower in Bethesda, MD
- $197 million office portion of the $330 million Gateway to Minneapolis building in Minneapolis
Through the first six months of 2019, the top 10 metropolitan areas in terms of the dollar amount of new office construction starts were:
- Washington DC
- New York
- Boston
- Atlanta
- Austin
- Dallas-Ft. Worth
- Richmond, VA
- Chicago
- Houston
- Philadelphia
Warehouse construction starts in June climbed 19%, boosted by the start of the $750 million Amazon Prime Air Hub at Cincinnati/Northern Kentucky International Airport, a $130 million Dollar Tree distribution center in the Houston area, and a $100 million Shugart Farms distribution center in Palmetto ,GA.
The other commercial building categories experienced decreased activity in June — stores, down 1%; commercial garages, down 9%; and hotels, down 11%. Despite the decline, the hotel category did include the $86 million hotel portion of the Gateway to Minneapolis mixed-use building.
Manufacturing plant construction in June retreated 45% from its robust May amount, which was boosted by the $1.6 billion Shintech polyvinyl chloride manufacturing facility in Plaquemine, LA, and a $600 million steel mill expansion in Osceola, AR. The largest manufacturing plant projects that were entered as June construction starts were a $500 million lithium battery manufacturing plant in Commerce, GA, and a $250 million segment of the Foxconn LCD display manufacturing complex in Mount Pleasant, WI.
Nonbuilding construction in June was $206.2 billion (annual rate), up 6% which followed a 32% surge in May. The electric utility/gas plant category continued to see strong activity, advancing 14%. Providing the lift in June was the $1.1 billion Energy Vision 2020 upgrades to wind power facilities in the states of Washington, Wyoming and Oregon. Also contributing were two substantial projects in Wyoming — a $1.0 billion expansion to a wind power complex and a $500 million transmission line project.
The public works categories as a group grew 2% in June after a 1% decline in May. The river/harbor development category provided the lift, rising 164% in June that reflected the start of a $524 million storage reservoir in Labelle, FL, a $243 million dredging project in Massena, NY, and a $100 million waterfront development project in Staten Island, NY.
The other two environmental public works categories weakened in June, with water supply construction down 3% and sewer construction down 30%. The miscellaneous public works category settled back 4% in June after its 17% increase in May. Even with its June decline, the miscellaneous public works category did include a $789 million segment of the border wall located in New Mexico.
Highway and bridge construction in June retreated 5%, settling back for the second month in a row after improved activity in March and April. The top five states in terms of the dollar amount of highway and bridge construction starts during the first six months of 2019 were Texas, California, Florida, New York and Illinois.
Residential building in June was $318.2 billion (annual rate), up 5% which followed a 2% gain in May. Multifamily housing registered its strongest amount since last November, advancing 26% in June. The pace for multifamily housing in June was 3% above its average monthly pace during 2018. There were 14 multifamily projects valued each at $100 million or more that reached groundbreaking in June, compared to eight such projects in May. The largest multifamily projects in June were:
- $640 million multifamily building in Brooklyn, NY, that’s part of the Pacific Park development
- $364 million multifamily building in Jersey City, NJ
- $200 million multifamily building in Houston
Through the first half of 2019, the top 10 metropolitan areas ranked by the dollar amount of multifamily starts were:
- New York
- Washington DC
- Los Angeles
- Miami
- Chicago
- Boston
- San Francisco
- Dallas-Ft. Worth
- Atlanta
- Austin
Single-family housing in June slipped 3%, receding after a 2% gain in May, as this project type has yet to see any sustained growth during the first half of 2019. The pace for single family housing in June was 6% below its average monthly pace during 2018. By region, the first half of 2019 showed this performance for single family housing compared to last year:
- South Atlantic, down 5%
- South Central, down 6%
- West, down 8%
- Midwest, down 11%
- Northeast, down 12%
 Dodge Data & Analytics
The 8% slide for total construction starts on an unadjusted basis during the first six months of 2019 was due to reduced activity by each of the three main construction sectors. Nonresidential building fell 10% year-to-date, with this pattern by segment — commercial building down 1%, institutional building down 7%, and manufacturing building down 49%.
The steep drop for manufacturing building is the result of the comparison to a very strong first half of 2018, that included such projects as a $6.5 billion uranium processing facility in Oak Ridge, TN. If the manufacturing building category is excluded, nonresidential building year-to-date would be down 4%.
Residential building year-to-date dropped 9%, with single family housing down 7% and multifamily housing down 14%.
Nonbuilding construction year-to-date decreased 5%, reflecting a 138% jump for electric utilities/gas plants combined with a 20% decline for public works. The miscellaneous public works category plunged 47% year-to-date, due to a sharply lower volume of new pipeline starts. If the miscellaneous public works category is excluded, public works construction during the first half of 2019 would have fallen a more moderate 6% and nonbuilding construction would be up 13%.
By major region, total construction starts during the first six months of 2019 showed this behavior:
- Midwest, down 5%
- Northeast, down 7%
- South Central, down 8%
- West and South Atlantic, each down 10%
On the basis of 12-month moving totals, in this case the 12 months ending June 2019 compared to the 12 months ending June 2018, total construction starts were down 4% from the previous period.
By major sector, nonresidential building fell 4%, with commercial building up 5%, institutional building down 6%, and manufacturing building down 28%. Nonbuilding construction dropped 7%, with electric utilities/gas plants up 42% and public works down 14%. Residential building slipped 2%, with 2% declines for both single family and multifamily housing.