- Record-long raw materials lead times
- Continued shortages of critical materials
- Rising commodities prices
- Difficulties in transporting products
- Optimistic panel sentiment
- Hiring difficult as workers opt for more attractive job opportunities
- Highest level of inventories expansion since 2010
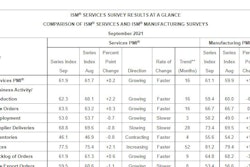
Economic activity in the manufacturing sector grew in September, with the overall economy notching a 16th consecutive month of growth, say the nation’s supply executives in the latest Manufacturing ISM Report on Business.
The report was issued by Timothy R. Fiore, chair of the Institute for Supply Management (ISM) Manufacturing Business Survey Committee. The ISM PMI index is a set of economic indicators based off surveys of private-sector companies in the manufacturing sector. A Manufacturing PMI above 43.1%, over a period of time, generally indicates an expansion of the overall economy.
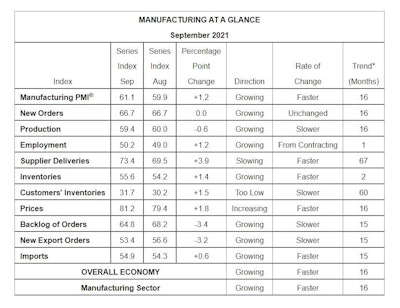
"The September Manufacturing PMI registered 61.1%, an increase of 1.2 percentage points from the August reading of 59.9%,” he says. “This figure indicates expansion in the overall economy for the 16th month in a row after contraction in April 2020.”
The Manufacturing PMI for September corresponds to a 5.1% increase in real gross domestic product (GDP) on an annualized basis, he says.
Survey respondents reported that their companies and suppliers continue to deal with an unprecedented number of hurdles to meet increasing demand.
“All segments of the manufacturing economy are impacted by record-long raw materials lead times, continued shortages of critical materials, rising commodities prices and difficulties in transporting products,” Fiore says. “Global pandemic-related issues — worker absenteeism, short-term shutdowns due to parts shortages, difficulties in filling open positions and overseas supply chain problems — continue to limit manufacturing growth potential. However, optimistic panel sentiment remains strong, with three positive growth comments for every cautious comment. Panelists are fully focused on supply chain issues in order to respond to the ongoing high levels of demand.”
Demand expanded, with the New Orders Index growing, supported by continued expansion of the New Export Orders Index, the Customers’ Inventories Index remaining at very low levels, and the Backlog of Orders Index staying at a very high level.
Consumption (measured by the Production and Employment indexes) grew slightly during the period, with a combined 0.6-percentage point increase to the Manufacturing PMI calculation. The Employment Index returned to expansion after one month of contraction, but hiring difficulties at panelists’ companies show no significant signs of abating.
 The Manufacturing PMI for the past 12 months.ISM
“Our company’s entire supply chain continues to have significant challenges getting manpower, which is impacting production of parts and ability to meet daily build schedules. Additionally, the logistics problems — especially port delays and a shortage of shipping containers — are significantly impacting inbound and outbound shipments,” one survey respondent in machinery says. “Raw materials costs still are at record highs, and we have raised customer pricing, with additional increases in the near future due to labor costs going up. Huge customer orders are nine months out (due to) backorders. (We’re) seeing this domestically and internationally.”
Inputs — defined as supplier deliveries, inventories, and imports — continued to support input-driven constraints to production expansion, at higher rates compared to August. The Supplier Deliveries Index reversed a recent pattern of softening, while the Inventories Index continued to expand faster due to work-in-process inventory being held longer because of key part shortages, as well as more finished goods inventory being held due to downstream customer issues. The Prices Index expanded for the 16th consecutive month, at a faster rate in September, indicating continued supplier pricing power and scarcity of supply chain goods.
The New Orders Index registered 66.7%, unchanged from the August reading. The Production Index registered 59.4%, a decrease of 0.6 percentage point compared to the August reading of 60%. The Prices Index registered 81.2%, up 1.8 percentage points compared to the August figure of 79.4%. The Backlog of Orders Index registered 64.8%, 3.4 percentage points lower than the August reading of 68.2%. The Employment Index returned to growth with a reading at 50.2%, 1.2 percentage points higher compared to the August reading of 49%. The Supplier Deliveries Index registered 73.4%, up 3.9 percentage points from the August figure of 69.5%. The Inventories Index registered 55.6%, 1.4 percentage points higher than the August reading of 54.2%. The New Export Orders Index registered 53.4%, a decrease of 3.2 percentage points compared to the August reading of 56.6%. The Imports Index registered 54.9%, an 0.6-percentage point increase from the August reading of 54.3%.
The six biggest manufacturing industries — petroleum and coal products, computer and electronic products, chemical products, food, beverage and tobacco products, fabricated metal products and transportation equipment, in that order — registered moderate to strong growth in September.
“Manufacturing performed well for the 16th straight month, with demand, consumption and inputs registering month-over-month growth, in spite of continuing unprecedented obstacles and ever-increasing demand,” Fiore says. “Panelists’ companies and their supply chains continue to struggle to meet demand due to difficulties in hiring and a clear cycle of labor turnover, as workers opt for more attractive job opportunities. Disruptions from COVID-19, primarily in Southeast Asia, continue to have an impact on many industry sectors. Congestion at ports in China and the U.S. continues to be a headwind, as transportation networks remain stressed. Demand remains at strong levels, despite increasing prices.”
The 17 manufacturing industries reporting growth in September — in the following order — are: furniture and related products; petroleum and coal products; machinery; electrical equipment, appliances and components; computer and electronic products; chemical products; apparel, leather and allied products; textile mills; paper products; printing and related support activities; miscellaneous manufacturing; food, beverage and tobacco products; fabricated metal products; transportation equipment; primary metals; nonmetallic mineral products; and plastics and rubber products. The only industry reporting a decrease in September compared to August is wood products.
Commodities
The following commodities were up in price for the month: (the number of consecutive months the commodity is listed is indicated after each item): adhesives (3); aluminum (16); aluminum extrusions (2); aluminum products (6); caustic soda (4); copper; corrugate (12); corrugated packaging (11); diesel fuel (9); electrical components (10); electrical motors (3); electronic components (10); foam; freight (11); high-density polyethylene (9); labor — temporary (5); logistics services; maintenance, repair, and operations supplies; natural gas (3); ocean freight (10); packaging supplies (10); pallets (3); paper; plastic containers; plastic resins (13); polyethylene (8); polypropylene (15); resins; resin-based products (8); rubber-based products (2); semiconductors (8); solvents; steel (14); steel — carbon (10); steel — cold rolled (2); steel — drums; steel — galvanized; steel — hot rolled (13); steel — stainless (11); steel products (13); surfactants; and tires.
Commodities down in price include: lumber (3); steel — scrap; and wood (2).
Commodities in short supply were: adhesives and paints (3); aluminum (6); aluminum products (5); corrugated packaging (3); electrical components (12); electronic components (10); freight; harnesses; labor — temporary (5); nylon 6,6 polymer; ocean freight (6); plastic containers; plastic products (8); plastic resins — other (7); plastic totes; polyvinyl chloride (pvc) plastics; printed circuit board assemblies (2); resin-based products (2); rubber-based products (2); semiconductors (10); steel (10); steel — hot rolled (11); steel — stainless (7); and steel products (8).

New Orders
ISM’s New Orders Index registered 66.7% in September, unchanged compared to the 66.7% reported in August. This indicates that new orders grew for the 16th consecutive month.
“All of the six largest manufacturing sectors — food, beverage and tobacco products; petroleum and coal products; computer and electronic products; chemical products; transportation equipment; and fabricated metal products, in that order — expanded at moderate to strong levels. This is the 15th consecutive month of index readings of above 60%, beating a 14-month streak (May 2017-June 2018) during the last manufacturing expansion. The monthly average during the current cycle exceeds that of the previous streak by 2 percentage points,” says Fiore.
A New Orders Index above 52.8%, over time, is generally consistent with an increase in the Census Bureau’s series on manufacturing orders (in constant 2000 dollars).
Of the 18 manufacturing industries, the 13 that reported growth in new orders in September, in the following order, are: primary metals; food, beverage and tobacco products; furniture and related products; petroleum and coal products; computer and electronic products; machinery; chemical products; miscellaneous manufacturing; paper products; nonmetallic mineral products; transportation equipment; electrical equipment, appliances and components and fabricated metal products.
 Production graph.ISM
Production
The Production Index registered 59.4% in September, 0.6 percentage point lower than the August reading of 60%, indicating growth for the 16th consecutive month.
“All of the top six industries — petroleum and coal products; transportation equipment; chemical products; fabricated metal products; food, beverage and tobacco products; and computer and electronic products, in that order — expanded at strong to moderate levels. Raw materials continued to be a constraint to production growth, as manufacturing inventories reached their highest levels in this cycle. Staffing levels on the factory floor remain an obstacle, with direct labor turnover and retirements becoming more prevalent,” says Fiore.
An index above 52.1%, over time, is generally consistent with an increase in the Federal Reserve Board’s Industrial Production figures.
The 14 industries reporting growth in production during the month of September, listed in order, are: printing and related support activities; furniture and related products; petroleum and coal products; textile mills; machinery; nonmetallic mineral products; transportation equipment; chemical products; fabricated metal products; food, beverage and tobacco products; primary metals; computer and electronic products; electrical equipment, appliances and components; and miscellaneous manufacturing.
 Employment numbers.ISM
Employment
ISM’s Employment Index registered 50.2% in September, 1.2 percentage points above the August reading of 49%.
“The Employment Index returned to expansion territory after one month below 50%. Of the six big manufacturing sectors, two (computer and electronic products; and fabricated metal products) expanded. Survey panelists’ companies are still struggling to meet labor-management plans, but there were modest signs of progress compared to previous months; less than 5% of comments noted improvements regarding employment, compared to none in August,” Fiore says.
An overwhelming majority of panelists indicate their companies are hiring or attempting to hire. When it comes to employment, 85% of Employment Index comments were about seeking additional staffing. Nearly half (47%) of those respondents expressed difficulty in filling positions, an increase from August. The increasing frequency of comments on turnover rates and retirements continued a trend that began in August, he says.
An Employment Index above 50.6%, over time, is generally consistent with an increase in the Bureau of Labor Statistics (BLS) data on manufacturing employment.
Of the 18 manufacturing industries, the six industries reporting employment growth in September, in the following order, are: electrical equipment, appliances and components; furniture and related products; computer and electronic products; primary metals; fabricated metal products; and machinery.
The six industries reporting a decrease in employment in September, listed in order, are: textile mills; petroleum and coal products; paper products; plastics and rubber products; food, beverage and tobacco products; and miscellaneous manufacturing. Six industries reported no change in employment in September compared to August.
 Supplier deliveries.ISM
Supplier Deliveries
The delivery performance of suppliers to manufacturing organizations was slower in September, as the Supplier Deliveries Index registered 73.4%, 3.9 percentage points higher than the 69.5% reported in August.
All six top manufacturing industries (fabricated metal products; food, beverage and tobacco products; computer and electronic products; petroleum and coal products; chemical products; and transportation equipment, in that order) reported slowing deliveries.
“Deliveries slowed at a faster rate compared to the previous month, reversing a three-month improvement trend. The index continues to reflect suppliers’ difficulties in meeting panelist companies’ demand, including (1) ongoing supplier hiring challenges, (2) extended raw materials lead times at all tiers, (3) increasing levels of input material shortages, (4) stubbornly high prices, and (5) inconsistent transportation availability,” says Fiore.
A reading below 50% indicates faster deliveries, while a reading above 50% indicates slower deliveries.
The 17 industries that reported slower supplier deliveries in September, in the following order, are: apparel, leather and allied products; textile mills; paper products; machinery; miscellaneous manufacturing; nonmetallic mineral products; fabricated metal products; food, beverage and tobacco products; computer and electronic products; furniture and related products; petroleum and coal products; plastics and rubber products; chemical products; wood products; transportation equipment; electrical equipment, appliances and components; and primary metals. No industries reported faster supplier deliveries in September.
 Inventories graph.ISM
Inventories
The Inventories Index registered 55.6% in September, 1.4 percentage points higher than the 54.2% reported for August.
“Manufacturing Inventories are clearly in expansion territory due to panelists’ companies accepting more raw materials inventory than they may use to reduce production shortages, work-in-process inventory accounts growing due to increasing part shortages, and growth of finished goods inventory as some panelists’ companies are held back from delivering due to customers’ throughput challenges,” Fiore says.
The petroleum and coal products and chemical products industries contributed to manufacturing inventory gains due to the impacts of shutdowns caused by Hurricane Ida, he says.
“This is the highest level of inventories expansion since October 2010, when the index registered 56.1%,” says Fiore.
An Inventories Index greater than 44.5%, over time, is generally consistent with expansion in the Bureau of Economic Analysis (BEA) figures on overall manufacturing inventories.
The 10 industries reporting higher inventories in September, in the following order, are: printing and related support activities; apparel, leather and allied products; petroleum and coal products; electrical equipment, appliances and components; paper products; transportation equipment; chemical products; machinery; computer and electronic products; and fabricated metal products. The four industries reporting a decrease in inventories in September are: nonmetallic mineral products; wood products; primary metals; and food, beverage and tobacco products.
 Prices graph.ISM
Prices Index
The ISM Prices Index registered 81.2%, an increase of 1.8 percentage points compared to the August reading of 79.4%, indicating raw materials prices increased for the 16th consecutive month, at a faster rate in September.
“Aluminum, basic chemicals, copper, corrugate and packaging materials, electronic components, energy, some plastics and plastic products, freight, and steels continue to remain at elevated prices due to product scarcity, with the index reversing prior month softening,” says Fiore.
A Prices Index above 52.7%, over time, is generally consistent with an increase in the Bureau of Labor Statistics (BLS) Producer Price Index for Intermediate Materials.
In September, 17 of 18 industries reported paying increased prices for raw materials, in the following order: apparel, leather and allied products; textile mills; printing and related support activities; paper products; plastics and rubber products; machinery; miscellaneous manufacturing; furniture and related products; nonmetallic mineral products; computer and electronic products; fabricated metal products; transportation equipment; food, beverage and tobacco products; primary metals; chemical products; electrical equipment, appliances and components; and wood products. The only industry reporting a decline in prices in September is petroleum and coal products.
 Backlog of Orders.ISM
Backlog of Orders
ISM’s Backlog of Orders Index registered 64.8% in September, a 3.4-percentage point decrease compared to the 68.2% reported in August, indicating order backlogs expanded for the 15th straight month.
“Backlogs expanded at a lower rate in September compared to August, indicating production was able to keep up with continuing strong new order levels. However, backlogs remain at historically high levels. Other than the current run above 60% which began this past February, the last time the Backlog of Orders Index was at this level was April 2004 (66.5%). Of the six big industry sectors, five (food, beverage and tobacco products; chemical products; transportation equipment; computer and electronic products; and fabricated metal products) reported that backlogs expanded strongly,” says Fiore.
The 14 industries reporting growth in order backlogs in September, in the following order, are: apparel, leather and allied products; furniture and related products; primary metals; machinery; food, beverage and tobacco products; miscellaneous manufacturing; nonmetallic mineral products; paper products; plastics and rubber products; chemical products; electrical equipment, appliances and components; transportation equipment; computer and electronic products; and fabricated metal products. No industry reported lower backlogs in September compared to August.