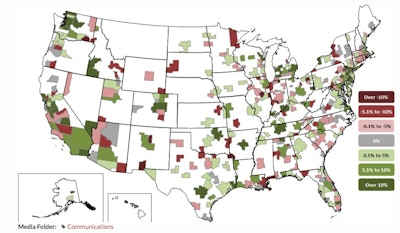
Construction Employment Has Weakest Expansion Since 2011

Fewer than half of the nation's metro areas added construction jobs between July 2014 and July 2015

Of the 358 metro areas for which the Labor Department provides construction employment data, only 168 (47%) experienced an increase in construction employment from July 2014 to July 2015. Construction employment declined in 138 metro areas (39%) and was level in 52 metros (15%).

Construction employment increased in fewer than half of the nation’s metro areas between July 2014 and July 2015, the weakest expansion since late 2011, according to a new analysis of federal employment data released today by the Associated General Contractors of America.  Association officials noted that the new jobs data comes while a series of vital federal infrastructure funding measures, notably the surface transportation program, languish unfinished in Congress.

“Although construction employment and spending are still expanding well overall, the gains are increasingly spotty,” said Ken Simonson, the association’s chief economist. “Uncertainty over funding for transportation infrastructure, a contraction in oil and gas drilling, and turmoil in international markets have left many local construction markets behind even as others grow strongly.”

Simonson noted that, of the 358 metro areas for which the Labor Department provides construction employment data, only 168 (47%) experienced an increase in construction employment from July 2014 to July 2015. Construction employment declined in 138 metro areas (39%) and was level in 52 metros (15%). Nationally, construction employment increased by 231,000 (3.8%) over the past 12 months.

Seattle-Bellevue-Everett, Wash. added the largest number of construction jobs in the past year (10,300 jobs, 13%) followed by:

  • Warren-Troy-Farmington Hills, Mich. (9,100 jobs, 20%)
  • Denver-Aurora-Lakewood, Colo. (8,900 jobs, 10%)
  • Chicago-Naperville-Arlington Heights, Ill. (8,500 jobs, 7%)
The largest percentage gains occurred in:
  • El Centro, Calif. (28%, 500 jobs)
  • Weirton-Steubenville, W.V.-Ohio (28%, 500 jobs)
  • Wenatchee, Wash. (23%, 500 jobs)
  • Warren-Troy-Farmington Hills, Mich.

The largest job losses from July 2014 to July 2015 were in Fort Worth-Arlington, Texas (-3,300 jobs, -4%) followed by:

  • New Orleans-Metairie, La. (-2,700 jobs, -9%)
  • Gulfport-Biloxi-Pascagoula, Miss. (-2,100 jobs, -23%)
  • Bergen-Hudson-Passaic, N.J. (-1,900 jobs, -6%)
  • Akron, Ohio (-1,800 jobs, -13%)
The largest percentage decline for the past year was in Gulfport-Biloxi-Pascagoula followed by:
  • Lawrence-Methuen Town-Salem, Mass.-N.H. (-16%, -400 jobs)
  • Bloomington, Ind. (-15%, -400 jobs)
  • Santa Fe, N.M. (-15%, -400 jobs)

Association officials urged Congress to take up the federal surface transportation bill and set funding levels for many other federal construction programs as soon as possible once members return to Washington after Labor Day. They added that without these measures in place, more areas of the country were likely to suffer drops in the total number of construction jobs.

“More metro areas are likely to suffer construction employment declines if policy makers in Washington fail to enact an adequately funded long-term bill for highway and transit infrastructure investment,” said Stephen E. Sandherr, the association’s chief executive officer.

View the employment data by rank and state

Page 1 of 1658
Next Page