March’s level of U.S. construction starts, excluding residential work, was $28.5 billion, a sharp climb of 18% versus February. That’s considerably better than the usual or long-term average February-to-March change of 2.5%. It’s closer to the traditional March-to-April jump of 12.0% (i.e., the largest month-to-month step upward during the year).
Also noteworthy with this report has been a significant upward revision in February’s starts, from $19.1 billion to $24.1 billion. Among type-of-structure categories, the biggest adjustments higher occurred in ‘parking garages’, private office buildings’, and ‘hospitals/clinics’.
The level of starts in March of this year compared with March 2015 was not that much different, 1.6%. January-to-March starts in 2016 versus 2015’s first quarter, however, have been 9.8%.
The starts figures throughout this report are not seasonally adjusted (NSA). Nor are they altered for inflation. They are expressed in what are termed ‘current’ as opposed to ‘constant’ dollars.
‘Nonresidential building’ plus ‘engineering/civil’ work accounts for a considerably larger share of total construction than residential activity. The former’s combined proportion of total put-in-place construction in the Census Bureau’s February report was 62%; the latter’s was 38%.
As reported in the latest Employment Situation Report from the Bureau of Labor Statistics (BLS), the construction sector added 37,000 jobs in March, its best gain so far this year. The monthly average in 2016 has been +25,000, or 7.1% compared with +23,000 in Q1 2015.
Year-over-year employment in construction in March was 4.7%, two-and-a-half times as fast as the 2.0% figure for all jobs in the economy. Next best among major industrial categories was ‘education and health’, 3.3%, followed by ‘professional and business services’ and ‘leisure and hospitality’, each 3.1%. Retail was 2.4% and manufacturing, a bleak -0.2%.
The jobless rate in construction in March — a time of year when winter’s lingering effects keep many workers off jobsites — was 8.7%. A year ago in March, though, it had been worse at 9.5%. Total jobs in architectural and engineering services in March flattened (0%) versus February but were still ahead to an encouraging degree (2.5%) year over year. They’ve been between 2% and 3% for the past 22 months. Just a slight push more and they’ll be restored to their pre-Great Recession peak.
There were month-to-month percentage increases in all the major type-of-structure categories in March, led by institutional (27.2%). Next in line and not that far behind was heavy engineering (20.7%), followed by commercial, which was also in double-digits (11.3%). Industrial was 5.2. The usually smaller-volume category of industrial can display wild swings from one month to the next depending on whether or not there has been a go-ahead for a mega project or two.
Comparing standalone March 2016 with its counterpart in 2015, the percent changes were more varied. Institutional (37%) was best. Commercial (15.1%), higher by less than half as much, placed second and heavy engineering/civil (5.6%) came in third. Industrial starts, with limited large project support in March 2016, were -81.9% compared with the same month of last year.
Year-to-date results through Q1 2016 have seen commercial (19.9%) and institutional (19.5%) in a virtual tie. Heavy engineering (5.8%) has been up but to a lesser extent. Industrial starts (-59.3%) have been down by more than half versus the same January-to-March period of 2015.
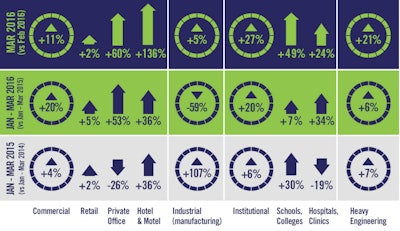
‘Private office buildings’ has been the largest subset category within commercial starts so far this year. Its percentage changes have been uniformly and impressively positive: 59.9% month to month (m/m); 120.1% year over year (y/y); and 52.8% year to date (ytd).
‘Retail/shopping’ has been the next largest contributor to commercial and its results have been mixed: 2.0% m/m and 5.3% ytd, but -23.3% y/y. Also significant, ‘hotel/motel’ starts have recorded a checkered, but mostly outstanding, set of percentage changes, 135.5% m/m; 3.6% y/y and 35.5% ytd.
More than 50% of the institutional category so far this year has consisted of ‘school/college’ starts, which were decently strong at 48.7% m/m, 15.1% y/y and 6.5% ytd. On balance, even better though, were ‘hospital/clinic’ starts: 24.4% m/m; 91% y/y; and 34.2% ytd.
‘Roads/highways’ is the dominant subset within heavy engineering/civil work and it turned in solid numbers in March: 18.9% m/m; 2.8% y/y; and 11.8% ytd.
The other two subset categories that have been particularly important for heavy engineering through 2016’ early going have been ‘bridges’ and ‘water/sewage’. Both have provided nothing but good news. The former has been 101.2% m/m, 66.5% y/y and 17.8% ytd, while the latter has been 8.8% m/m; 5% y/y; and 9.8% ytd.
Only the smaller-volume subcategory of ‘dam/marine’ work within heavy engineering has faltered so far this year: -67.9% m/m; -70% y/y; and -56.9% ytd.
The economy-wide jobless rate in March was 5%. It has hovered near that tight level for the past eight months. Worker compensation, though, remains restrained. For all private sector employees in March, year-over-year average hourly and average weekly earnings were 2.3% and 2% respectively. Employees in construction didn’t fare quite as well, 2.2% and 1.5%.
Excluding supervisory personnel, however, improves the picture for workers in the construction sector. Their 2.4% y/y average hourly and 2.7% y/y average weekly pay rises have exceeded the pay check increases of 2.3% and 2% earned by all non-boss workers throughout the U.S.
The value of construction starts each month is summarized from CMD’s database of all active construction projects in the U.S. Missing project values are estimated with the help of RSMeans’ building cost models.
CMD’s non-residential construction starts series, because it is comprised of total-value estimates for individual projects, some of which are ultra-large, has a history of being more volatile than many other leading indicators for the economy.