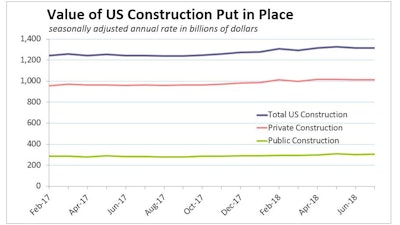
The value of all U.S. construction put in place in July edged 0.1% higher to a seasonally adjusted annual rate of $1.3 trillion, even as the Commerce Department revised most June and May estimates lower. Total construction spending since the first of the year (not seasonally adjusted) is 5.2% higher than the first seven months of 2017.
 Year-to-date totals show solid growth compared to 2017, lead by a 7.6% increase in residential spending, 3.6% growth in highway and street spending and 4.9% more commercial building.
Total residential spending increased 0.6% in July, however nearly all of the gain occurred in home improvement outlays, which rose 2.1%. Single and multifamily expenditures declined 0.3% and 0.4%, respectively.
Total nonresidential spending slipped 0.3% during the month. A 3.4% drop in value of commercial building construction and 0.7% slip in power construction helped push private nonresidential expenditures 1.0% lower (private nonresidential construction had been growing most of this year). Public nonresidential spending rose 0.7%, driven by 2.1% growth in educational construction that easily counterbalanced a 1.3% drop in transportation construction. Public spending on highways and streets increased 0.4%.
In contrast to the volatile monthly spending data, year-to-date totals show solid growth compared to 2017, lead by a 7.6% increase in the vast residential spending category, 3.6% growth in total highway and street spending and 4.9% more commercial building. Office construction is up 7.2% and building in the transportation sector has leapt 15.8% for the year.