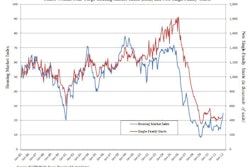
After showing struggling business conditions for most of 2011, the Architecture Billings Index (ABI) has now reached positive terrain in consecutive months. As a leading economic indicator of construction activity, the ABI reflects the approximate nine to twelve month lag time between architecture billings and construction spending.
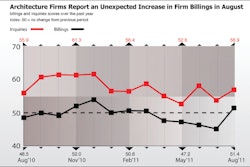
The American Institute of Architects (AIA) reported the December ABI score was 52.0, following the same mark in November. This score reflects an overall increase in demand for design services (any score above 50 indicates an increase in billings). The new projects inquiry index was 64.0, down just a point from the previous month.
“We saw nearly identical conditions in November and December of 2010 only to see momentum sputter and billings fall into negative territory as we moved through 2011, so it’s too early to be sure that we are in a full recovery mode,” said AIA Chief Economist, Kermit Baker, PhD, Hon. AIA. “Nevertheless, this is very good news for the design and construction industry and it’s entirely possible conditions will slowly continue to improve as the year progresses.”
December highlights:
- Regional averages: South (54.2), Midwest (53.1), Northeast (52.6), West (45.1)
- Sector index breakdown: multi-family residential (54.3), commercial / industrial (54.1), institutional (51.3), mixed practice (44.5)
- Project inquiries index: 64.0
Regional and sector categories are calculated as a 3-month moving average, whereas the index and inquiries are monthly numbers.
The Architecture Billings Index (ABI), produced by the AIA Economics & Market Research Group, is a leading economic indicator that provides an approximately nine to twelve month glimpse into the future of nonresidential construction spending activity. The diffusion indexes contained in the full report are derived from a monthly “Work-on-the-Boards” survey that is sent to a panel of AIA member-owned firms. Participants are asked whether their billings increased, decreased, or stayed the same in the month that just ended as compared to the prior month, and the results are then compiled into the ABI. These monthly results are also seasonally adjusted to allow for comparison to prior months.
Monthly ABI index scores are centered around 50, with scores above 50 indicating an aggregate increase in billings, and scores below 50 indicating a decline. The regional and sector data are formulated using a three-month moving average. More information on the ABI and the analysis of its relationship to construction activity can be found in the White Paper Architecture Billings as a Leading Indicator of Construction: Analysis of the Relationship Between a Billings Index and Construction Spending on the AIA web site.