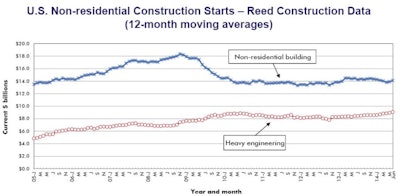
According to Reed Construction Data, the dollar value of construction starts in June, excluding residential activity, surged 34 percent versus May. The figures are in “current” dollars, meaning they are not adjusted for inflation.
The individual month of June, at $32 billion, was one of the strongest in Reed's entire data base. To find a similarly high volume, one has to look back to June 2008, just before the Great Recession really took hold.
The one-third increase was an outsized gain, even after taking into account seasonality. Reed's long-term average May-to-June increase has been 4.5 percent.
By comparison, May’s month-to-month percentage change was +6.2 percent and April’s, -4.5 percent.
June starts this year compared with June of last year were +14.4 percent. The year-to-date level of total non-residential construction starts, at $138 billion, was +2.4 percent when compared with the same January to June period of 2013.
Non-residential construction accounts for a considerably larger share of the total than residential work. The former’s proportion of total put-in-place construction in the Census Bureau’s May report was 62 percent versus the latter’s 38 percent.
Reed’s construction starts are leading indicators for the Census Bureau’s capital investment or put-in-place series.
After a shockingly harsh winter, during which gross domestic product (GDP) contracted, the U.S. economy is back on an expansionary path with stock market indices near record highs and the unemployment rate close to the nation’s 20-year average of 6 percent. Firms in the private sector are feeling more pressure to build new facilities.
The month-to-month leaders among major non-residential construction categories were commercial, +39 percent, and heavy engineering, +34.7 percent. Institutional work was also up, +3.6 percent, but to a much lesser degree. Industrial starts recorded a large percentage gain, but it came on top of a smaller dollar volume than the other three.
Commercial starts this June were even more impressive, +48.5 percent, when compared with June of last year. Engineering starts this June versus the same month last year were +13.7 percent. Institutional starts were -8.1 percent.
Year to date, heavy engineering (+13 percent) is out front, followed by institutional (+5.9 percent). Commercial starts (-14.5 percent) are still down from last year. Industrial work is +13.5 percent.
In commercial construction’s two largest sub-categories, retail starts were +8.3 percent month to month, but -8.1 percent year to date, while private office building starts were +81.6 percent month to month and +29.6 percent year to date.
In the institutional category of work, school and college starts were +7.5 percent month to month and +9.7 percent year over year. Hospital/clinic starts moved in the opposite direction, -43.2 percent month to month and -12.3 percent year to date.
With the exception of dam/marine work, all the sub-categories of heavy engineering construction were ahead both month to month and year to date, with water and sewage work especially strong versus May, +40.2 percent.
Institutional and heavy engineering work have especially close ties to government finances. Washington’s deficit is diminishing, although the debt load remains high. At the state and local levels, the ongoing improvement in the overall economy is providing budgetary pay-offs.
The nonresidential construction sector will derive benefits from taxes that are increasing naturally. Stronger employment and higher incomes lift income tax revenues; advances in consumer spending yield more sales taxes; and rising home prices translate into improved property taxes.
The value of construction starts each month is summarized from Reed’s database of all active construction projects in the U.S. Missing project values are estimated with the help of RSMeans’ building cost models.
A start is determined by taking the announced bid date and adding 30 days. It is then assumed the project will break ground within 30 to 60 days of the start date. Reed continues to follow the project via its network of researchers. If it is abandoned or re-bid, the start date is updated to reflect the new information.